The Juno spacecraft continues to send back incredible photos of Jupiter’s atmosphere. This video animates images from the sixth close pass of Jupiter to give you a sense of what Juno sees as it swoops by our system’s largest planet. The trajectory passes from the north pole to the south, showing Jupiter’s whitish zones, dark belts, and massive storms. Up close Jupiter looks like an Impressionist painting, all vortices and shear instabilities. The large white spots you see are enormous counterclockwise rotating vortices known as anticyclones – many of them larger than our entire planet. (Video credit: NASA / SwRI / MSSS / G. Eichstädt / S. Doran)
Tag: atmospheric science

Sky Glow


This short but spectacular timelapse video shows the Grand Canyon filled with fog. This phenomenon, known as a temperature inversion, occurs when a warm layer of air traps cold, moist air near the ground. As the inversion develops in the video, you can see wisps of clouds popping up in the canyon, seemingly out of nowhere, as moisture evaporated from the surface condenses in the cool air. Once fog fills the canyon, it flows and laps against the canyon’s sides, much like waves on the ocean. In fact, the physics here is quite similar, just at a much slower speed. (Video and image credit: H. Mehmedinovic / SKYGLOWPROJECT; via Gizmodo; submitted by Ian S.)

Simulating Thunderstorms
With today’s supercomputing power, it’s possible to simulate entire thunderstorms to study how and why some of them can spawn deadly tornadoes. The animation above comes from a computer simulation of a supercell thunderstorm. The simulation uses initial conditions from a 2011 storm that produced an EF-5 tornado – the highest category of tornado, based on its wind speeds. To see more of the simulation, check out the video below. One thing that might surprise you is just how enormous the towering supercell clouds are compared to the tornado produced in the simulation. Often what we can see of a storm from the ground is only the tiniest part of what goes into producing it. (Image credit: L. Orf et al., source; GIF via @popsci; video credit: UWSSEC)

Venusian Waves
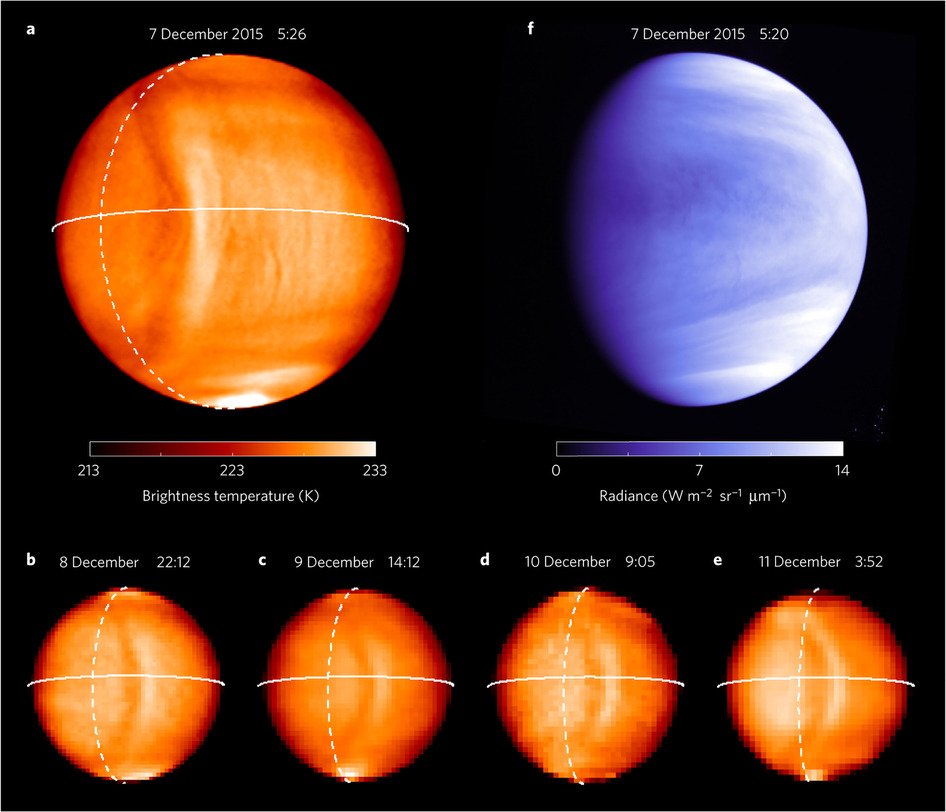
Despite its proximity, Venus remains largely mysterious, thanks to its cloudy atmosphere and incredible harsh conditions. A recent study using data from the Japanese satellite Akatsuki revealed an enormous bow-shaped wave in the Venusian atmosphere. The wave appeared at an altitude of about 65 km and stretched more than 10,000 km long, across both the northern and southern hemispheres. Although surface winds on Venus are believed to be small due to its incredibly slow rotation, winds higher in the atmosphere are much faster – so it was strange to observe this wave sitting essentially stationary for five days of observation.
When the scientists mapped the location of wave relative to the surface, they found it was sitting over the Aphrodite Terra highlands, suggesting that this structure is a gravity wave generated by winds interacting with the topography. Similar, albeit smaller, gravity waves are often observed on Earth near mountains. The finding raises questions about our understanding of Venusian atmospheric dynamics and exactly how disturbances from surface winds could create enormous structures so high in the atmosphere. (Image credit: T. Fukuhara et al.; h/t to SciShow Space)

Happy Valentine’s Day
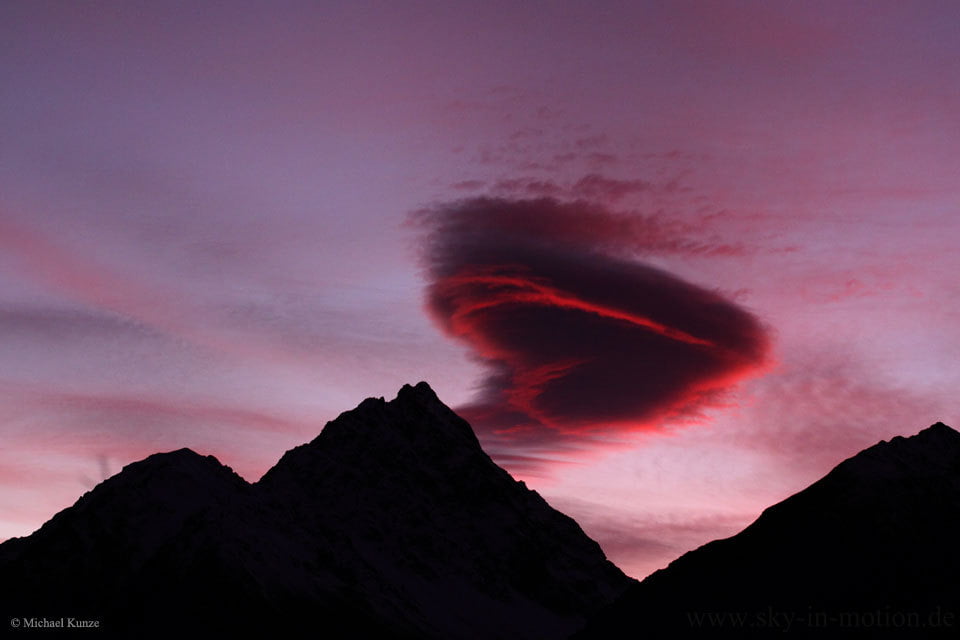
This heart-shaped atmospheric apparition is a lenticular cloud captured over the mountains of New Zealand. As you can see in the companion video, the cloud itself remains stationary over the mountain. This is a key feature of lenticular clouds, which form when air flowing over/around an obstacle drops below the dew point. This causes moisture in the air to condense for a time before it descends and warms once more. Thus, even though air is continuously flowing past, what we see is a stationary, lens-shaped cloud. Happy Valentine’s Day from FYFD! (Image credit: M. Kunze, video; via APOD)
Simulating the Earth
Computational fluid dynamics and supercomputing are increasingly powerful tools for tracking and understanding the complex dynamics of our planet. The videos above and below are NASA visualizations of carbon dioxide in Earth’s atmosphere over the course of a full year. They are constructed by taking real-world measurements of atmospheric conditions and carbon emissions and feeding them into a computational model that simulates the physics of our planet’s oceans and atmosphere. The result is a visualization of where and how carbon dioxide moves around our planet.
There are distinctive patterns that emerge in a visualization like this. Because the Northern Hemisphere contains more landmass and more countries emitting carbon, it contains the highest concentrations of carbon dioxide, but winds move those emissions far from their source. As seasons change and plants begin photosynthesizing in the Northern Hemisphere, concentrations of carbon dioxide decrease as plants take it up. When the seasons change again, that carbon is re-released.
These visualizations underscore the fact that these carbon emissions impact everyone on our planet–nature does not recognize political borders–and so we share a joint responsibility in whatever actions we take. (Video credit: NASA Goddard; h/t to Chris for the second vid)

CYGNSS


Yesterday marked the launch of a new constellation of eight microsatellites, the Cyclone Global Navigation Satellite System (CYGNSS), designed to monitor hurricanes in Earth’s tropics. The constellation will provide unprecedented capability to monitor conditions inside hurricanes–information that will hopefully help scientists improve hurricane prediction models. Each CYGNSS microsat monitors GPS signals that it receives from the GPS satellite system and from the reflection of that signal off the Earth. By comparing these signals, the satellites can determine wave heights in the ocean, and from that wave information, they can measure surface wind speeds. By peering inside the hurricane as it forms and travels, scientists hope they will be better able to estimate not only a hurricane’s path but how strong it will be when it makes landfall. (Image credits: NASA)

Where Jupiter’s Heat Comes From
Exactly what goes on in Jupiter’s atmosphere has confounded scientists for decades. Its upper atmosphere – essentially the only part we can observe – is hundreds of degrees warmer than solar heating can account for. Although it has bright auroras at its poles, that energy is trapped at high altitudes by the same rotational effects that create Jupiter’s stunning bands.
Observations of Jupiter’s Great Red Spot, a storm that’s lasted for hundreds of years, may provide clues as to where all the extra heat is coming from. Spectral mapping shows that the area over the Spot is over 1000K warmer than the rest of the upper atmosphere. Because of its isolated location, the best explanation for the Great Red Spot’s extra heat comes from below: scientists suspect that the raging storm is generating so much turbulence and such a deafening roar that these gravity and acoustic waves propagate upward and heat the atmosphere above. If so, a similar coupling mechanism to the clouds below may account for the widespread warmth in Jupiter’s upper atmosphere. (Image credit: NASA; research credit: J. O’Donoghue et al.)

Crisscrossing Clouds
This natural-color satellite image shows crisscrossing cloud patterns off coastal Africa. These distinctive lines in the sky are gravity waves, and they form when air masses get displaced upward by terrain or other conditions. In this case, dry air cooled overnight on land before moving out over the ocean. That displaced warm, humid air above the water and forced it upward, where it eventually cooled and condensed into clouds. Gravity created the ripple-like waves; as the moist air cooled, gravity again pulled it downward – leaving behind a clear sky. Once the humid air sank, the dry air pushed it up again, creating another line of clouds and continuing the cycle. (Image credit: NASA; via NASA Earth Observatory)

Dust Devils
Dust devils, like fire tornadoes and waterspouts, form from warm, rising air. As the sun heats the ground to temperatures hotter than the surrounding atmosphere, hot air will begin to rise. When it rises, that air leaves behind a region of lower pressure that draws in nearby air. Any vorticity in that air gets intensified as it gets pulled toward the low pressure area. It will start to spin faster, exactly like a spinning ice skater who pulls in his arms. The result is a spinning vortex of air driven by buoyant convection. On Earth, dust devils are typically no more than a few meters in size and can only pick up light objects like leaves or hay. On Mars, dust devils can be hundreds of meters tall, and, though they’re too weak to do much damage, they have helpfully cleaned off the solar panels of some of our rovers! (Image credit: T. Bargman, source; via Gizmodo)