
A large part of the Wright Brothers’ ultimate success in creating the first powered heavier-than-air craft came as a result of work done in their homemade wind tunnel, shown above. In the aftermath of the failure of their 1901 Glider, the brothers decided that the lift and drag data they had used from Otto Lilienthal must be inaccurate. They built this wind tunnel and its force balances to measure lift and drag on two hundred different airfoils themselves and were rewarded with far more successful flights with their 1902 Glider, which led directly to the Wright Flyer in the following year. #
Search results for: “wind tunnel”

Automotive Wind Tunnels
Wind tunnels have been a staple of aerodynamics since the Wright brothers built one to help them test wing shapes for their gliders and airplanes. The GM Aerodynamics Laboratory’s much larger wind tunnel, pictured above, tests full-sized vehicles’ aerodynamics. It is the largest automotive wind tunnel and has been in operation since August 1980. GM estimates that it has cut the coefficient of drag on vehicles by approximately 25% in that time. The tunnel can reach speeds near 125 mph, as one hapless reporter discovered firsthand. (Submitted by @Vinnchan)

Paris 2024: Cycling in Crosswinds
Wind plays a major role in cycling, since aerodynamic drag is the greatest force hampering a cyclist. In road racing, both individual cyclists and teams use tactics that vary based on the wind speed and direction. Crosswinds — when the apparent wind comes from the side in the cyclist’s point of view — are some of the toughest conditions to deal with. In races, groups will often form echelons to minimize the group’s overall effort in a crosswind. Alternatively, racers looking to tire their competitors out will position themselves on the road so that the rider behind them gets little to no shelter from the wind; this is known as guttering an opponent.
In this study, researchers put a lone cyclist in a wind tunnel and measured the effects of crosswind from a pure headwind to a pure tailwind and every possible angle in between. From that variation, they were able to mathematically model the aerodynamic effects of crosswind on a cyclist from every angle. With rolling resistance (a cyclist’s second largest opposing force) included, they found relatively few conditions where a crosswind actually helped a cyclist. Most of the time — as any cyclist can tell you — hiding from the wind is beneficial. (Image credit: J. Dylag; research credit: C. Clanet et al.)
Related topics: The physics of the Tour de France, how the peloton protects riders aerodynamically, track cycling physics, and a look inside wind tunnel testing bikes and cyclists

Researching Wind Turbines
Two of the most awesome things (in my admittedly biased opinion) about fluid dynamics are the amazing facilities we build for experiments and the tests they allow us to do. In this video, you get a behind-the-scenes look at one such facility, used for wind turbine research at Princeton.
One challenge of wind turbine research is accurately capturing the aerodynamic effects of full-scale wind turbines in the controlled-environment of a laboratory. At Princeton, they match conditions between their model turbines and the real ones by drastically raising the density in their wind tunnel. This means that running the tunnel requires a series of compressors and storage tanks full of compressed air, and it also means that the wind tunnel itself has to be quite hefty to handle the pressure difference inside and out. Definitely check out the full video for more on their wind tunnel and what it can help them learn about wind turbines. (Video credit: M. Miller and J. Keifer; submitted by M. Miller)
Specialized’s Win Tunnel
Awhile back, I mentioned that bike manufacturer Specialized had built their own wind tunnel to test cycling equipment. In this video, they provide a walk-through of their facility. Although there are features unique to this tunnel and its intended purpose, much of what Chris and Mark describe is standard for any subsonic wind tunnel. The story begins upstream in the inlet and contraction, where air is pulled into the tunnel. Honeycomb flow straighteners direct the incoming air, followed by a series of mesh screens. These screens break up any turbulent eddies, which helps smooth and laminarize the flow. The test section is where measurements occur, whether on cyclists or other models. This part of the tunnel is usually equipped with many sensors and specialized equipment, like the balance shown. These allow researchers to measure quantities like force, velocity, pressure, and/or temperature. Then the wind tunnel widens gradually in a diffuser, which slows down the air and helps prevent disturbances from propagating upstream. Finally, the fans at the back provide the source of low-pressure that drives the air flow. (Video credit: Specialized Bicycles; submitted by J. Salazar)
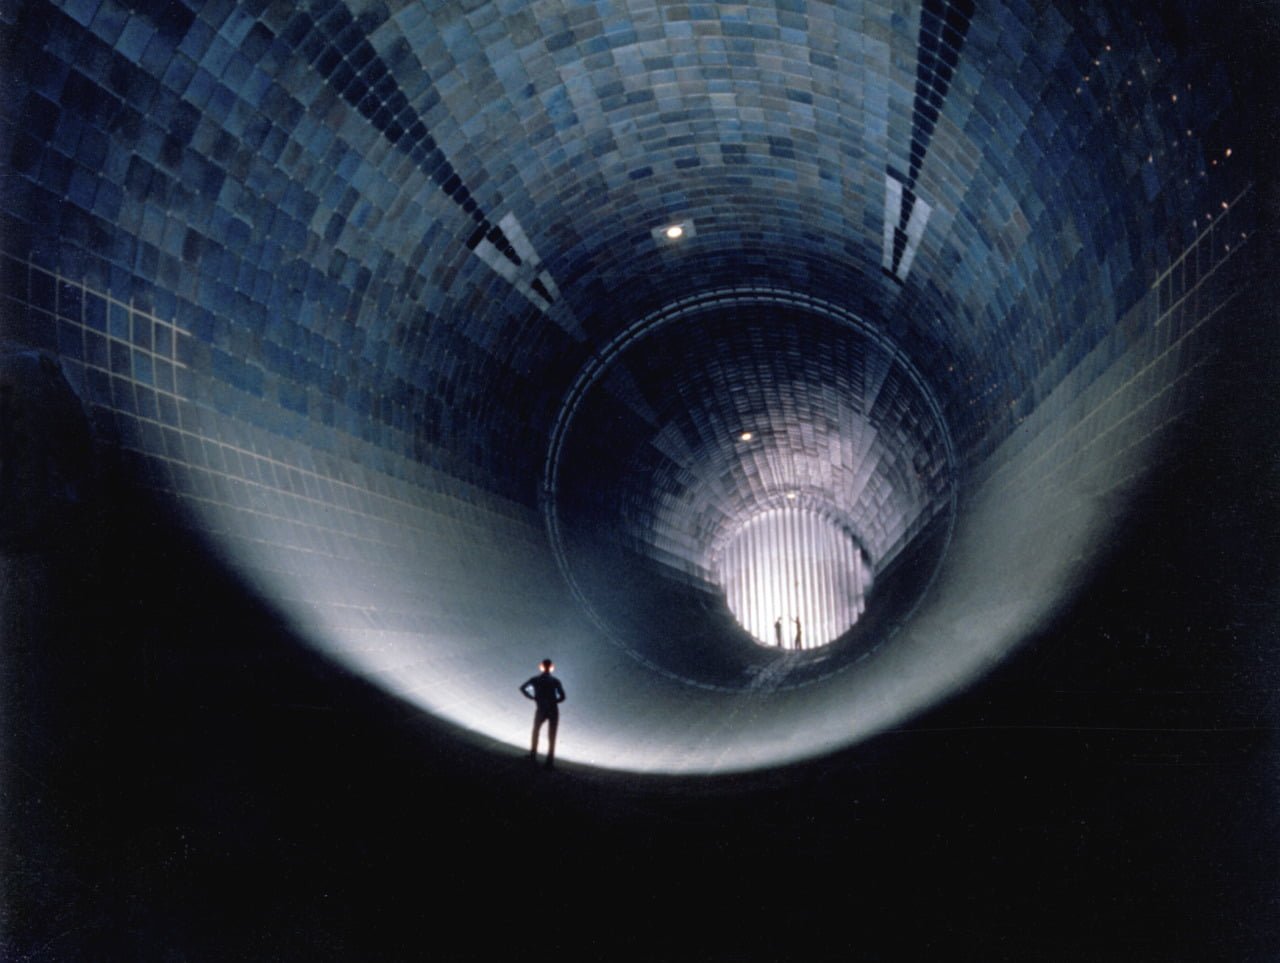
AEDC 16-ft Supersonic Tunnel
This 1960 photo shows three men standing inside Arnold Engineering Development Complex’s 16-ft supersonic wind tunnel facility. The wind tunnel was capable of Mach numbers between 1.60 and 4.75 through a test section 4.8 meters wide and 20.2 meters long. It served as a large-scale testing facility for aircraft and propulsion systems. Like many large-scale and high-speed wind tunnel facilities in the United States, it is no longer active. In recent years, many unique wind tunnel facilities at NASA, military bases, and universities have been closed down, depriving researchers and engineers of the ability to include large-scale testing in their design and development of new technologies. These facility closures leave a substantial gap between the speeds and Reynolds numbers achievable in small-scale experiments and computational fluid dynamics and those experienced in flight. (Photo credit: P. Tarver)
Measuring Wind Turbines with Snowfall
One of the challenges in large-scale wind energy is that operating wind turbines do not behave exactly as predicted by simulation or wind tunnel experiments. To determine where our models and small-scale experiments are lacking, it’s useful to make measurements using a full-scale working turbine, but making quantitative measurements in such a large-scale, uncontrolled environment is very difficult. Here researchers have used natural snowfall as seeding particles for flow visualization. The regular gaps in the flow are vortices shed from the tip of the passing turbine blades. With a searchlight illuminating a 36 m x 36 m slice of the flow behind a wind turbine, the engineers performed particle image velocimetry, obtaining velocity measurements in that region that could then be correlated to the wind turbine’s power output. Such in situ measurements will help researchers improve wind turbine performance. (Video credit: J. Hong et al.)

Milano Cortina 2026: Ski Jumping Suits
Ski jumping is in the news this Olympic cycle after rumors that male competitors may be cheating in order to wear larger suits. In particular, the suggestion is that male athletes are injecting fillers into their genitals before their pre-season 3D body scan in order to appear large enough to allow them to wear a larger suit. This comes after two Norwegian ski jumpers were punished for illegally restitching the crotches of their suits to make them larger.
Ski jumping is a sport that relies heavily on aerodynamics; during the flight phase, jumpers try to maximize their lift-to-drag ratio so that they stay aloft as long as possible. A 2025 study underscores the importance of suit size in this calculus. In the work, the researchers used a baseline suit that was 4 centimeters larger in circumference than their jumper–the loosest configuration that regulations allow. They compared that suit’s flight performance (in wind tunnels and simulation) to a suit 2 cm larger and one 2 cm smaller. The extra 2 centimeters of circumference made a notable difference: the larger suit increased the drag by ~4% and lift by ~5%. That was enough, in their simulation, to let a jumper fly an extra 5.8 meters.
It’s worth noting, though, that the study was looking at the effects of adjusting the suit’s circumference along the entire length between the arm pits and the knees; they never changed anything about the suit’s crotch. I don’t think there’s enough scientific data to say that packing a bit more there would really offer aerodynamic advantages. And the risks of such injections are non-negligible. (Image credit: T. Trapani; research credit: M. Virmavirta et al.; via Ars Technica)

Fediverse Reactions
-
Saving Energy By Following a Leader
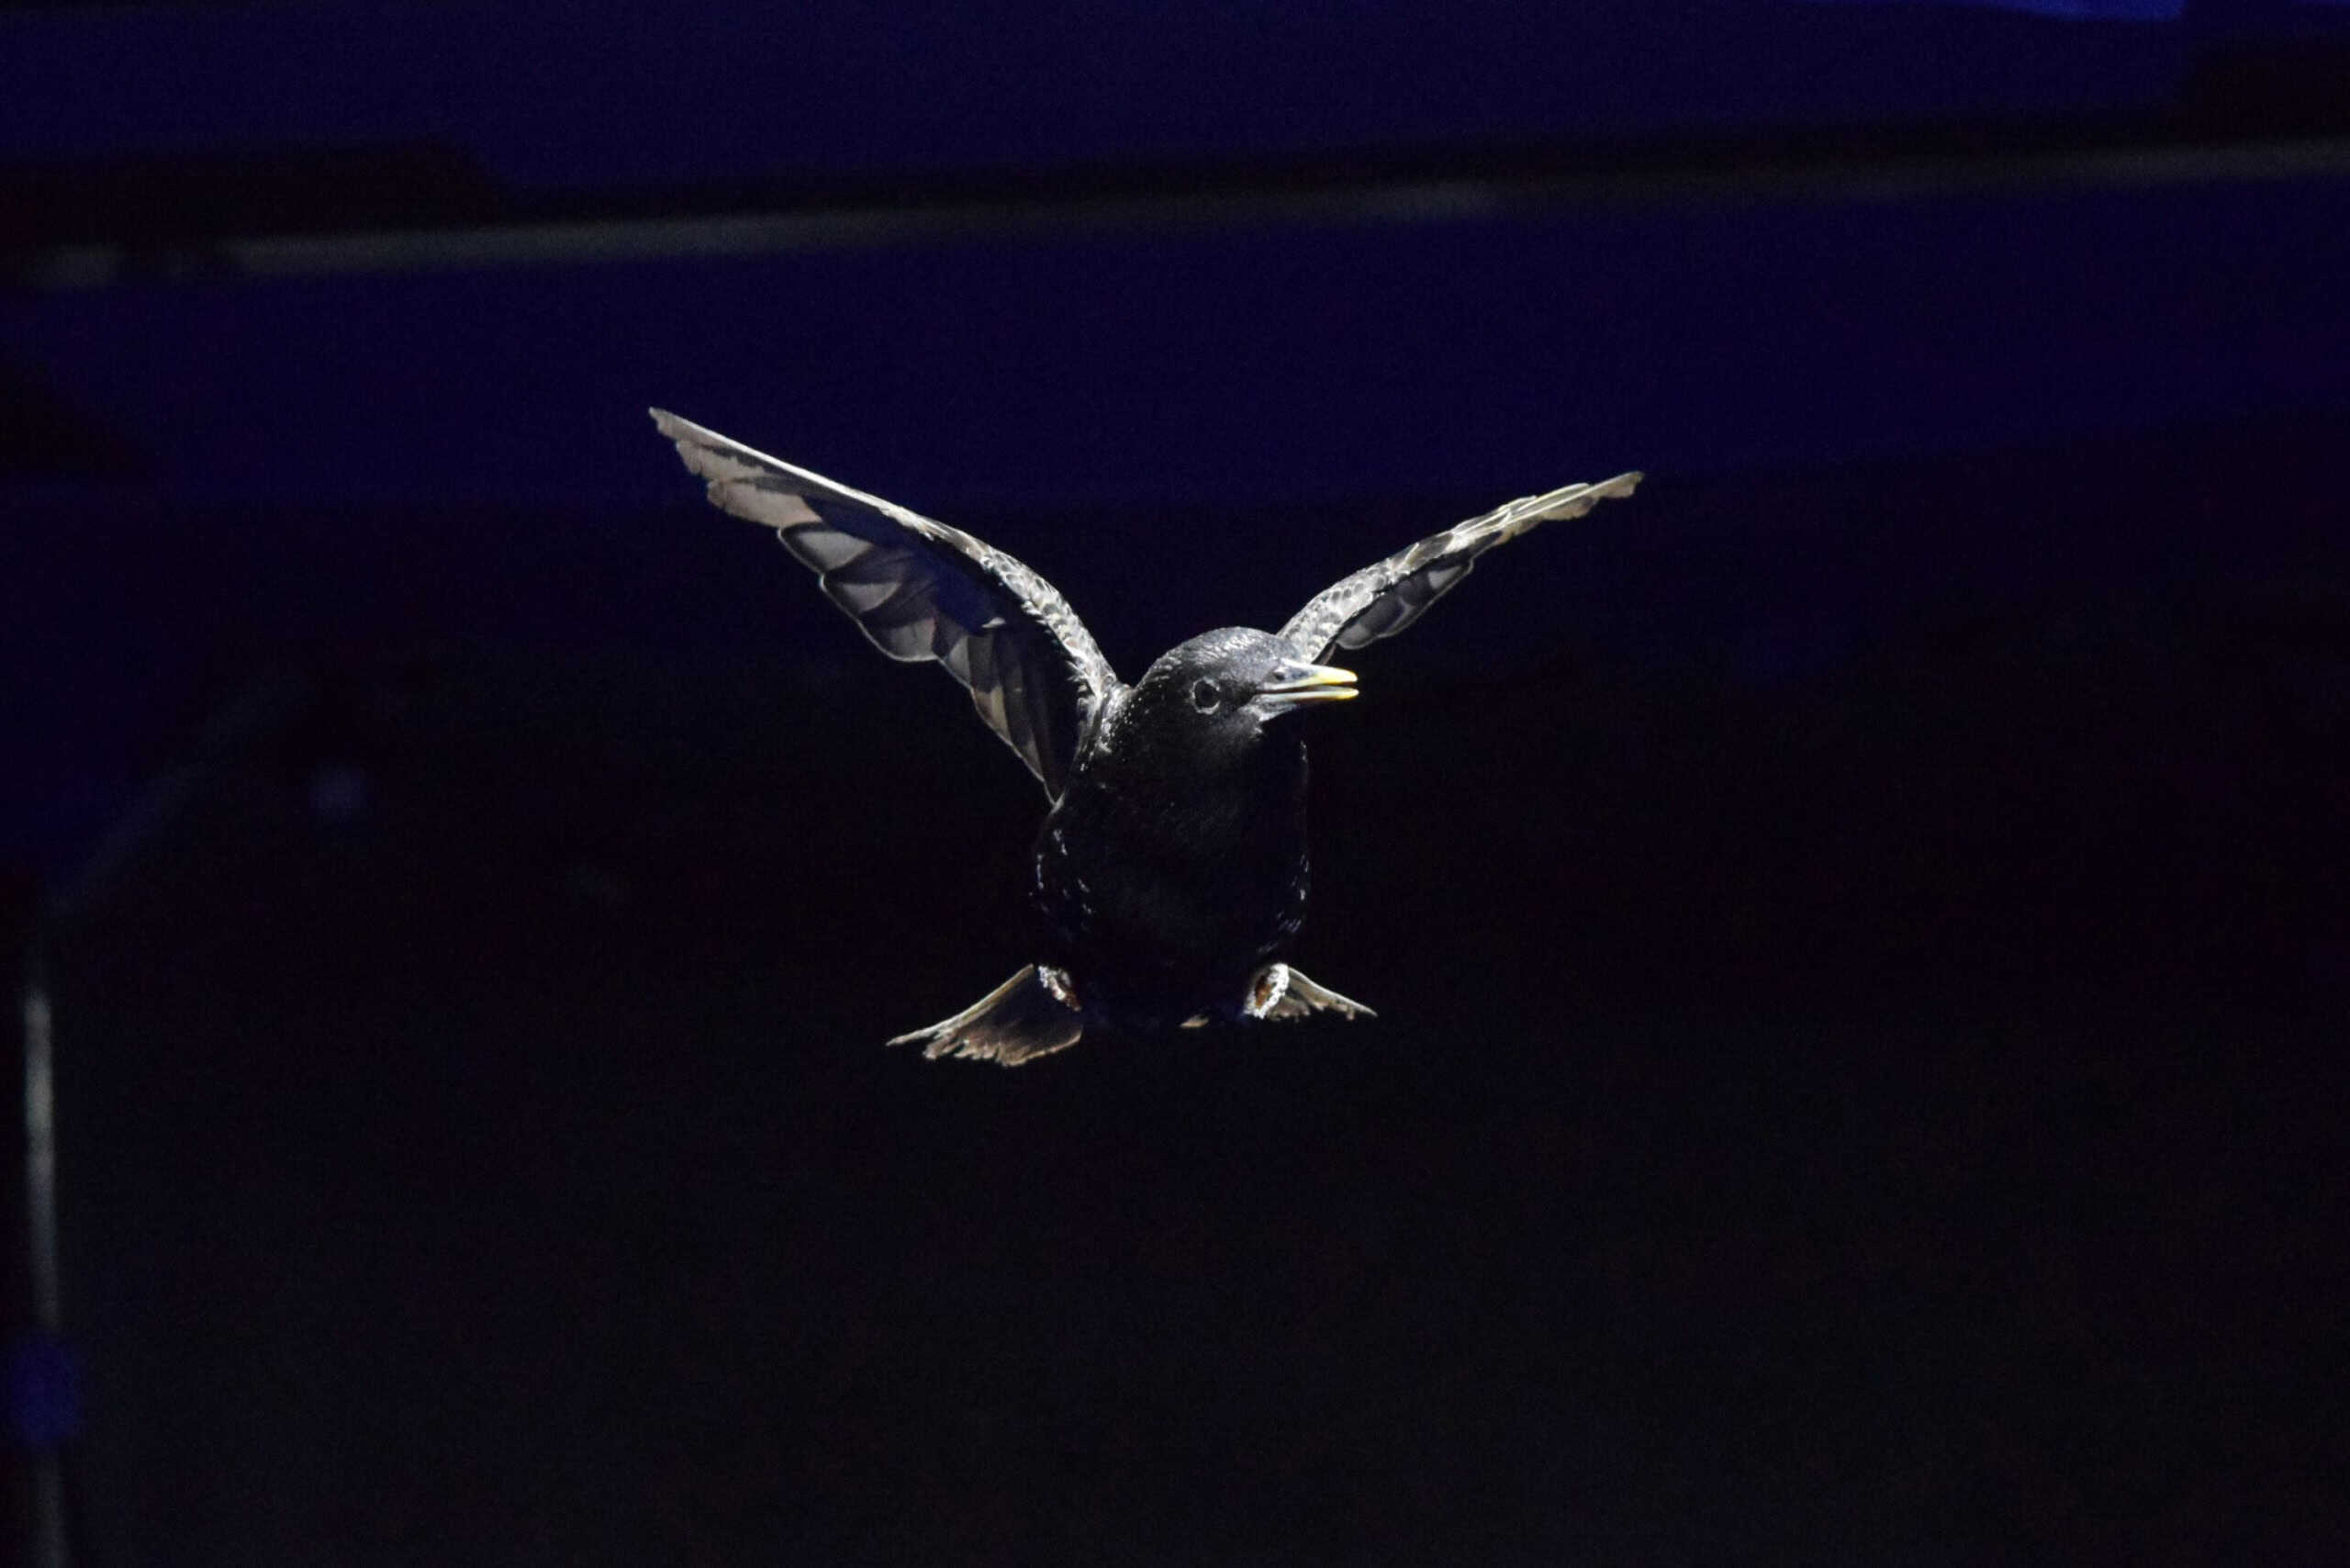
Scientists have long suspected that birds save energy by following a leader — think of the V-shaped flight formation used by geese — but a new study captures that savings directly. The team studied starlings, flying singly or in groups of two or three, in a special wind tunnel. Each bird wore a tiny backpack with sensors and lights that captured its motion and helped researchers identify it individually in videos. And, using before and after metabolic measurements, the researchers could pin down exactly how much energy each bird used when flying.
They found that birds who spent most of the flight in a “follower” position used up to 25% less energy than they did when flying solo. That’s a major incentive to follow someone else. Interestingly, they also found that the most efficient solo fliers were the birds most likely to take on the “leader” position. The team notes that these “leaders” tend to use a lower wing-flapping frequency, but a full explanation of how they save energy will require a follow-up study. (Image credit: R. Gissler and S. Hao; research credit: S. Friman et al.; via Physics World)
Kirigami Parachutes


To fly stably, parachutes need to deform and allow some air to pass through their canopy. In this video, researchers investigate kirigimi parachutes, inspired by a form of paper art that uses cuts to create three-dimensional shapes. After laser-cutting, these disks are dropped — or placed in a wind tunnel — to observe how they “fly” at different speeds. Sometimes they flutter or bend; other shapes elongate in the flow. (Video and image credit: D. Lamoureux et al.; via GoSM)