A buoyant bubble rises until it’s stopped by a wall. What happens, this video asks, if that wall vibrates up and down? If the vibration is large enough, the bubble loses its symmetry and starts to gallop along the wall. Using numerical simulations, the team determined the flow around the bubble. They also demonstrate several possible applications for this behavior: sorting bubbles by size, traversing mazes, and cleaning a surface. (Video and image credit: J. Guan et al.)
Tag: experimental fluid dynamics

Soaring Through the Pillars of Creation
The Pillars of Creation are an iconic feature nestled within the Eagle Nebula. For decades, the public has admired Hubble’s images of this stellar nursery, and, in this video, we get to fly between the pillars, shifting between Hubble’s visible light imagery and JWST’s infrared views. In visible light, glowing dust obscures the interior of the pillars, drawing our eyes instead to the dusty shapes eroded by the stellar winds of these young stars. In infrared wavelengths, we see further into the pillars, revealing individual stars burning at the ends of the pillars’ fingers. Being able to peer at the same problem through different techniques — here visible and infrared light — reveals more to scientists than either mode can on its own. (Image/video credit: G. Bacon et al.; via Gizmodo)

A mosaic of Hubble and JWST’s views of the Pillars of Creation, in visible and infrared light, respectively. 
Saving Energy By Following a Leader
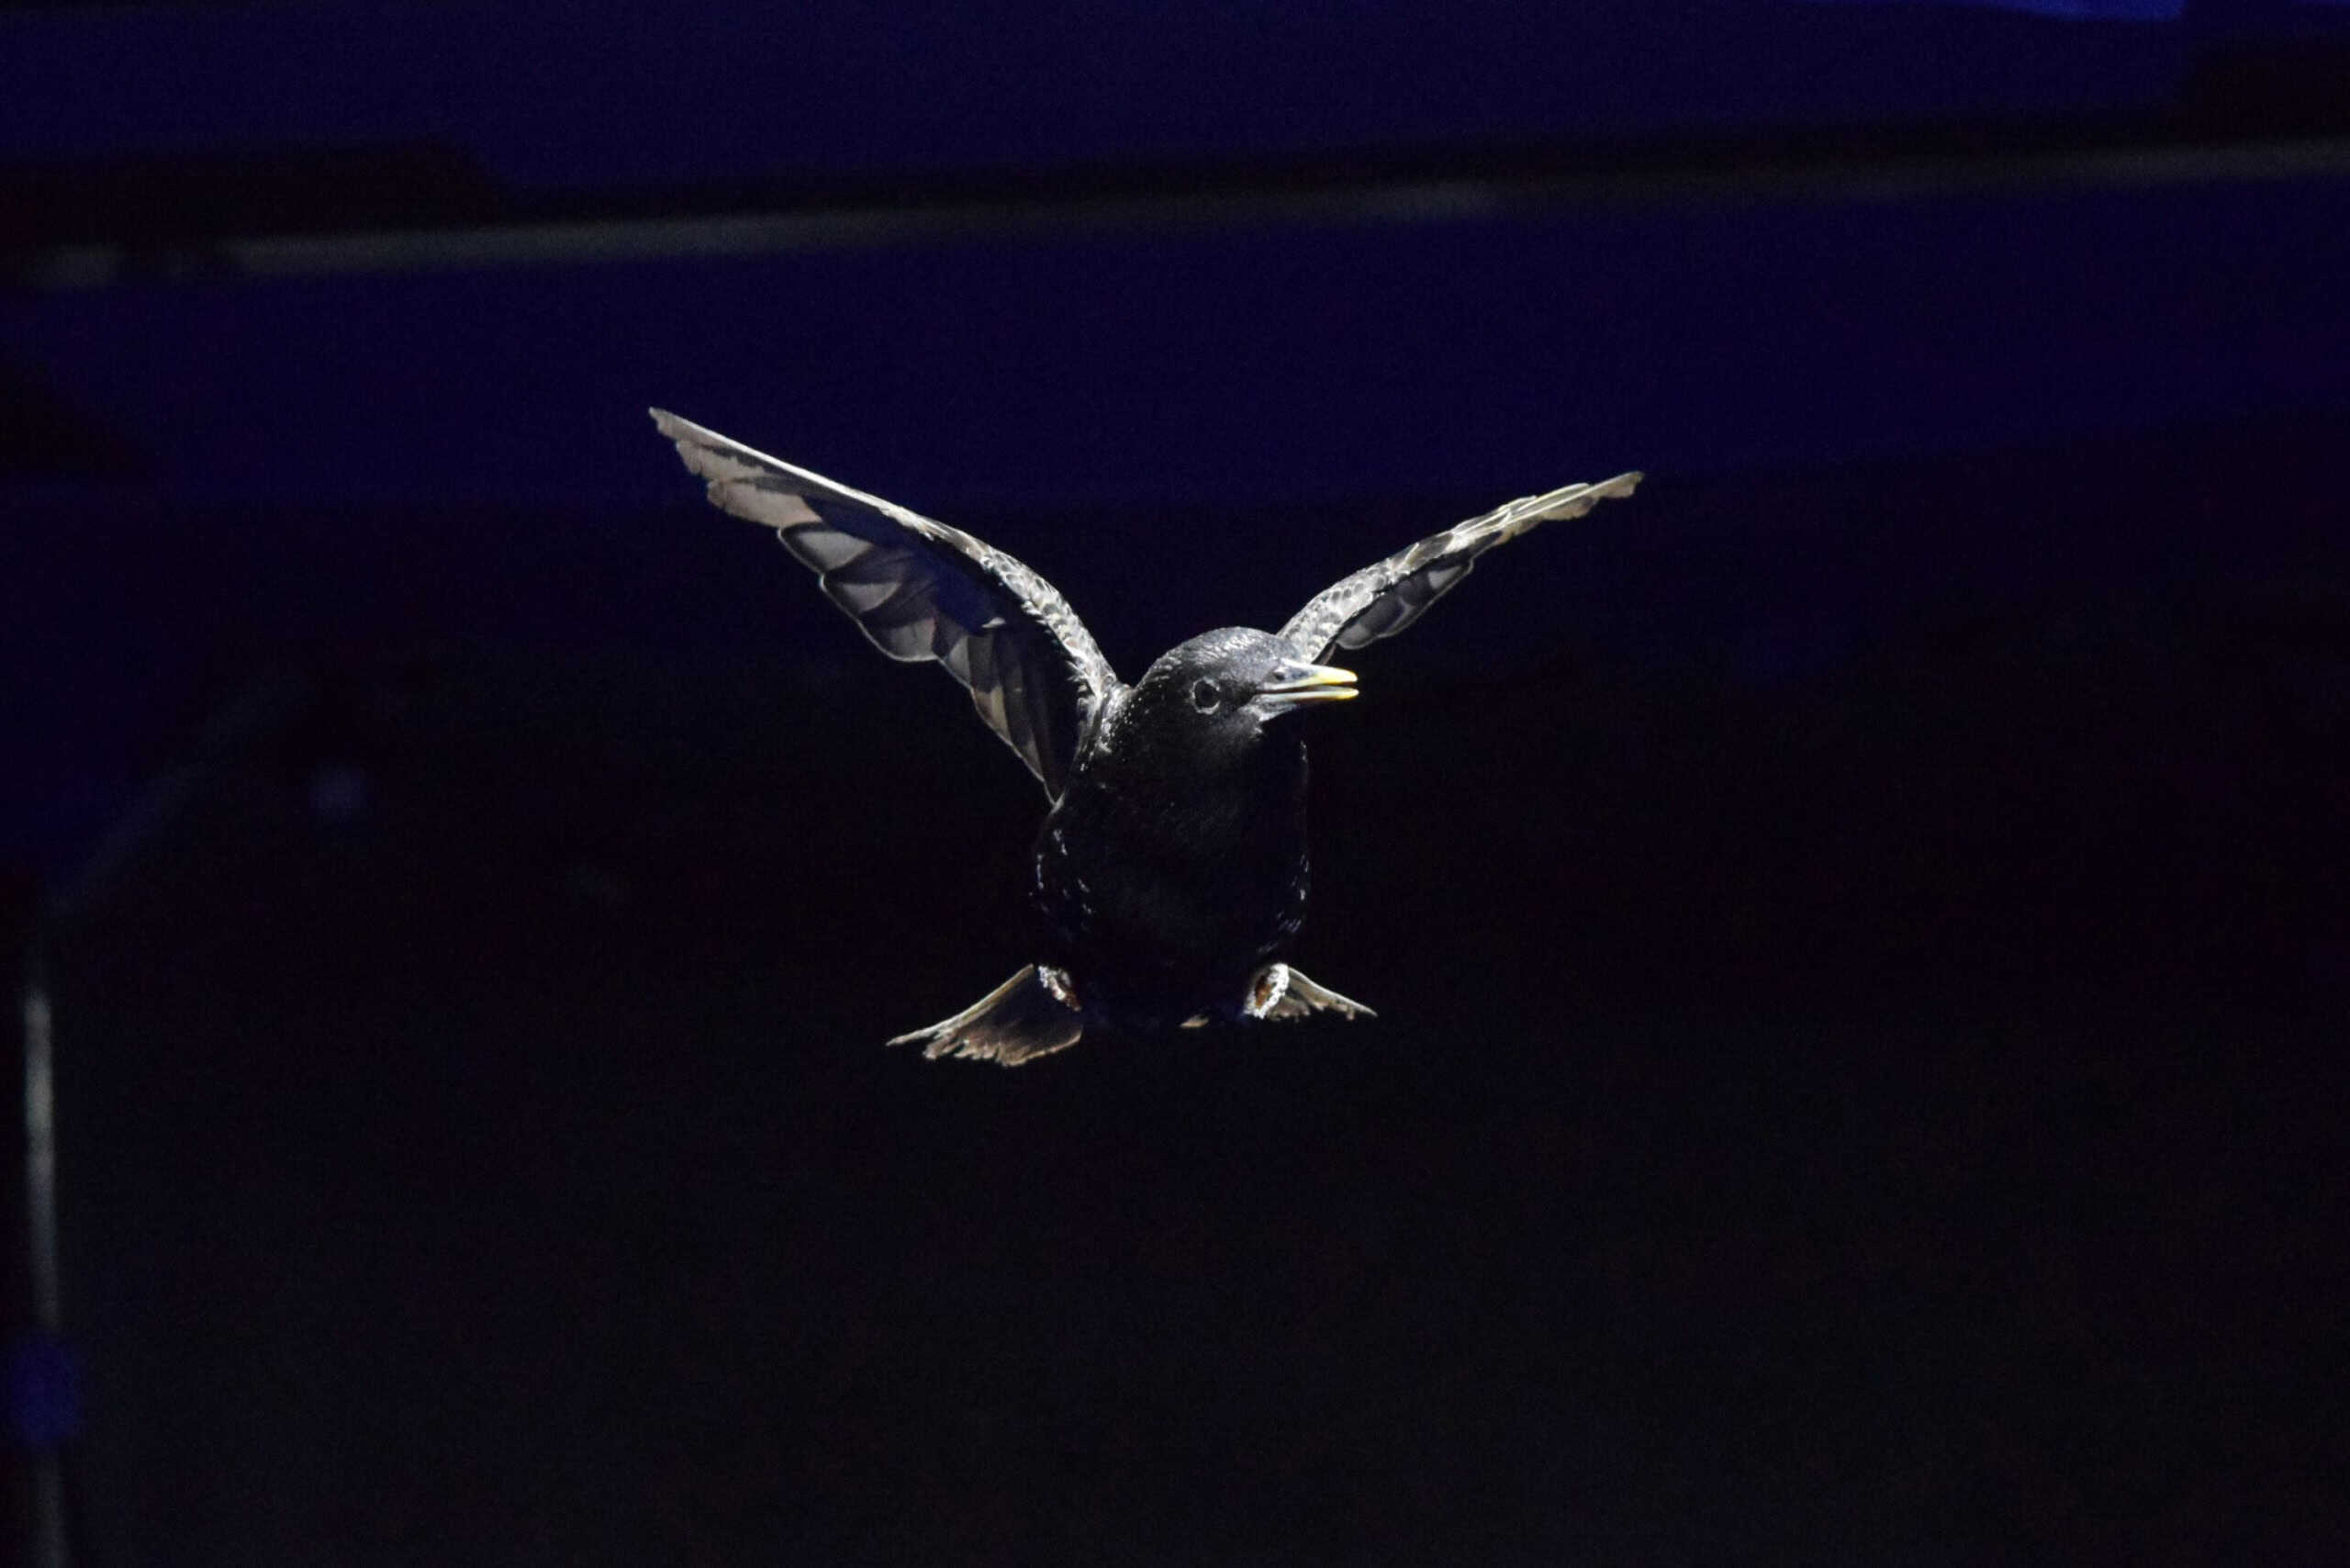
Scientists have long suspected that birds save energy by following a leader — think of the V-shaped flight formation used by geese — but a new study captures that savings directly. The team studied starlings, flying singly or in groups of two or three, in a special wind tunnel. Each bird wore a tiny backpack with sensors and lights that captured its motion and helped researchers identify it individually in videos. And, using before and after metabolic measurements, the researchers could pin down exactly how much energy each bird used when flying.
They found that birds who spent most of the flight in a “follower” position used up to 25% less energy than they did when flying solo. That’s a major incentive to follow someone else. Interestingly, they also found that the most efficient solo fliers were the birds most likely to take on the “leader” position. The team notes that these “leaders” tend to use a lower wing-flapping frequency, but a full explanation of how they save energy will require a follow-up study. (Image credit: R. Gissler and S. Hao; research credit: S. Friman et al.; via Physics World)

Farewell, Saffire!
After eight years and six flight tests, NASA said a fiery farewell to the Spacecraft Fire Safety Experiment, or Saffire, mission. Each Saffire test took place on an uncrewed Cygnus supply vehicle after undocking from the space station. Cygnus craft burn up during atmospheric re-entry, so using them as a platform guaranteed safety for the station’s crew.
A Plexiglass sample burns as part of Saffire-V’s experiments. In this experiment, researchers found that flames grew and spread faster on thin ribs of Plexiglass (left) than on thicker samples (right). Saffire itself used a small wind tunnel to push air past its burning materials. The tests included materials like plexiglass, cotton, Nomex, and other fabrics that might be found on a spacecraft or its occupants. The goal, of course, is to understand how fires grow and spread in a spacecraft in order to protect the crew. To that end, Saffire experiments recorded not only what went on inside their test unit, but also what the conditions were in the spacecraft as Saffire burned. (Image and video credit: NASA; via Gizmodo and NASA Glenn)

Tracking Break-Up
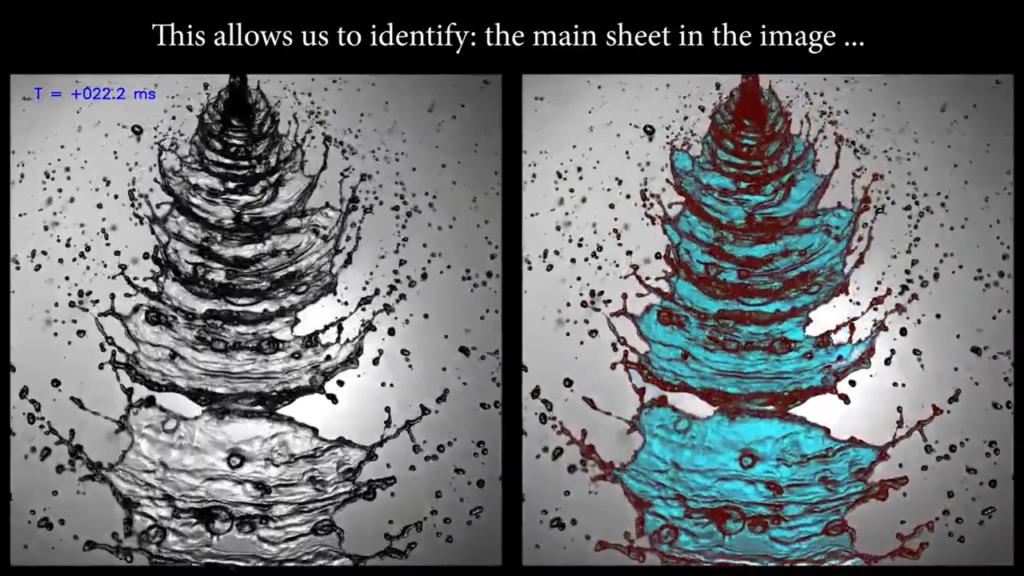
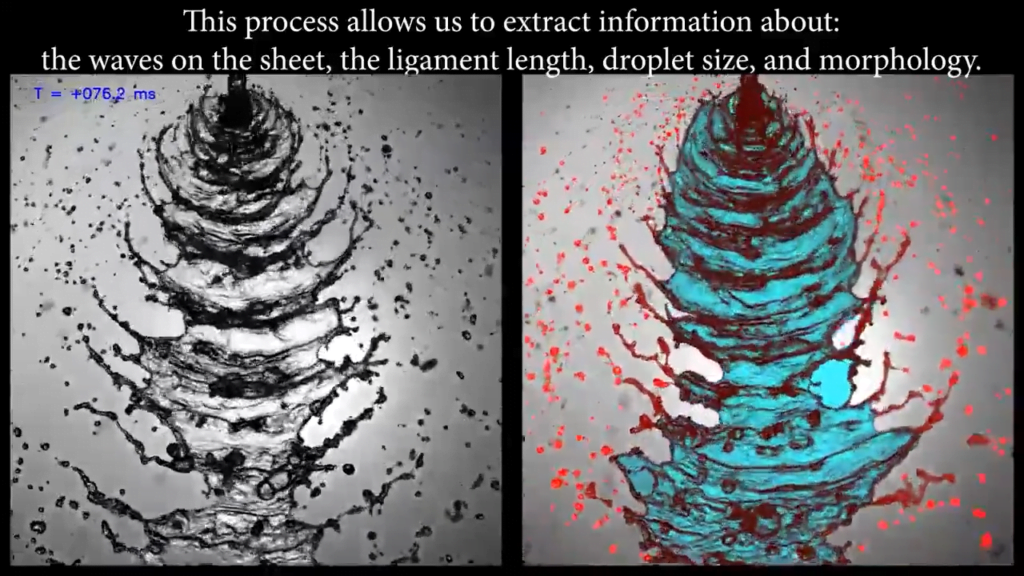
In fluid dynamics, researchers are often challenged with complicated, messy flows. With so much going on at once, it’s hard to work out a way to keep track of it all. Here, researchers are looking at the break-up of two colliding liquid jets. This setup is often used to break rocket fuel into droplets prior to combustion. This video shows off a new data analysis tool that lets researchers break the flow into different parts, track them in time, and extract data about the changes that happen along the way. (Video and image credit: E. Pruitt et al.)

Tumbling in Air
When snowflakes and volcanic ash fall, they tumble. Historically, it’s been too hard to observe this behavior first hand — the particles are too small to easily follow with a camera — so scientists instead looked at larger particles falling through water. That change preserves important characteristics of the physics, but it misses out on one key feature: in air, the density of the falling particle is much higher than air’s.

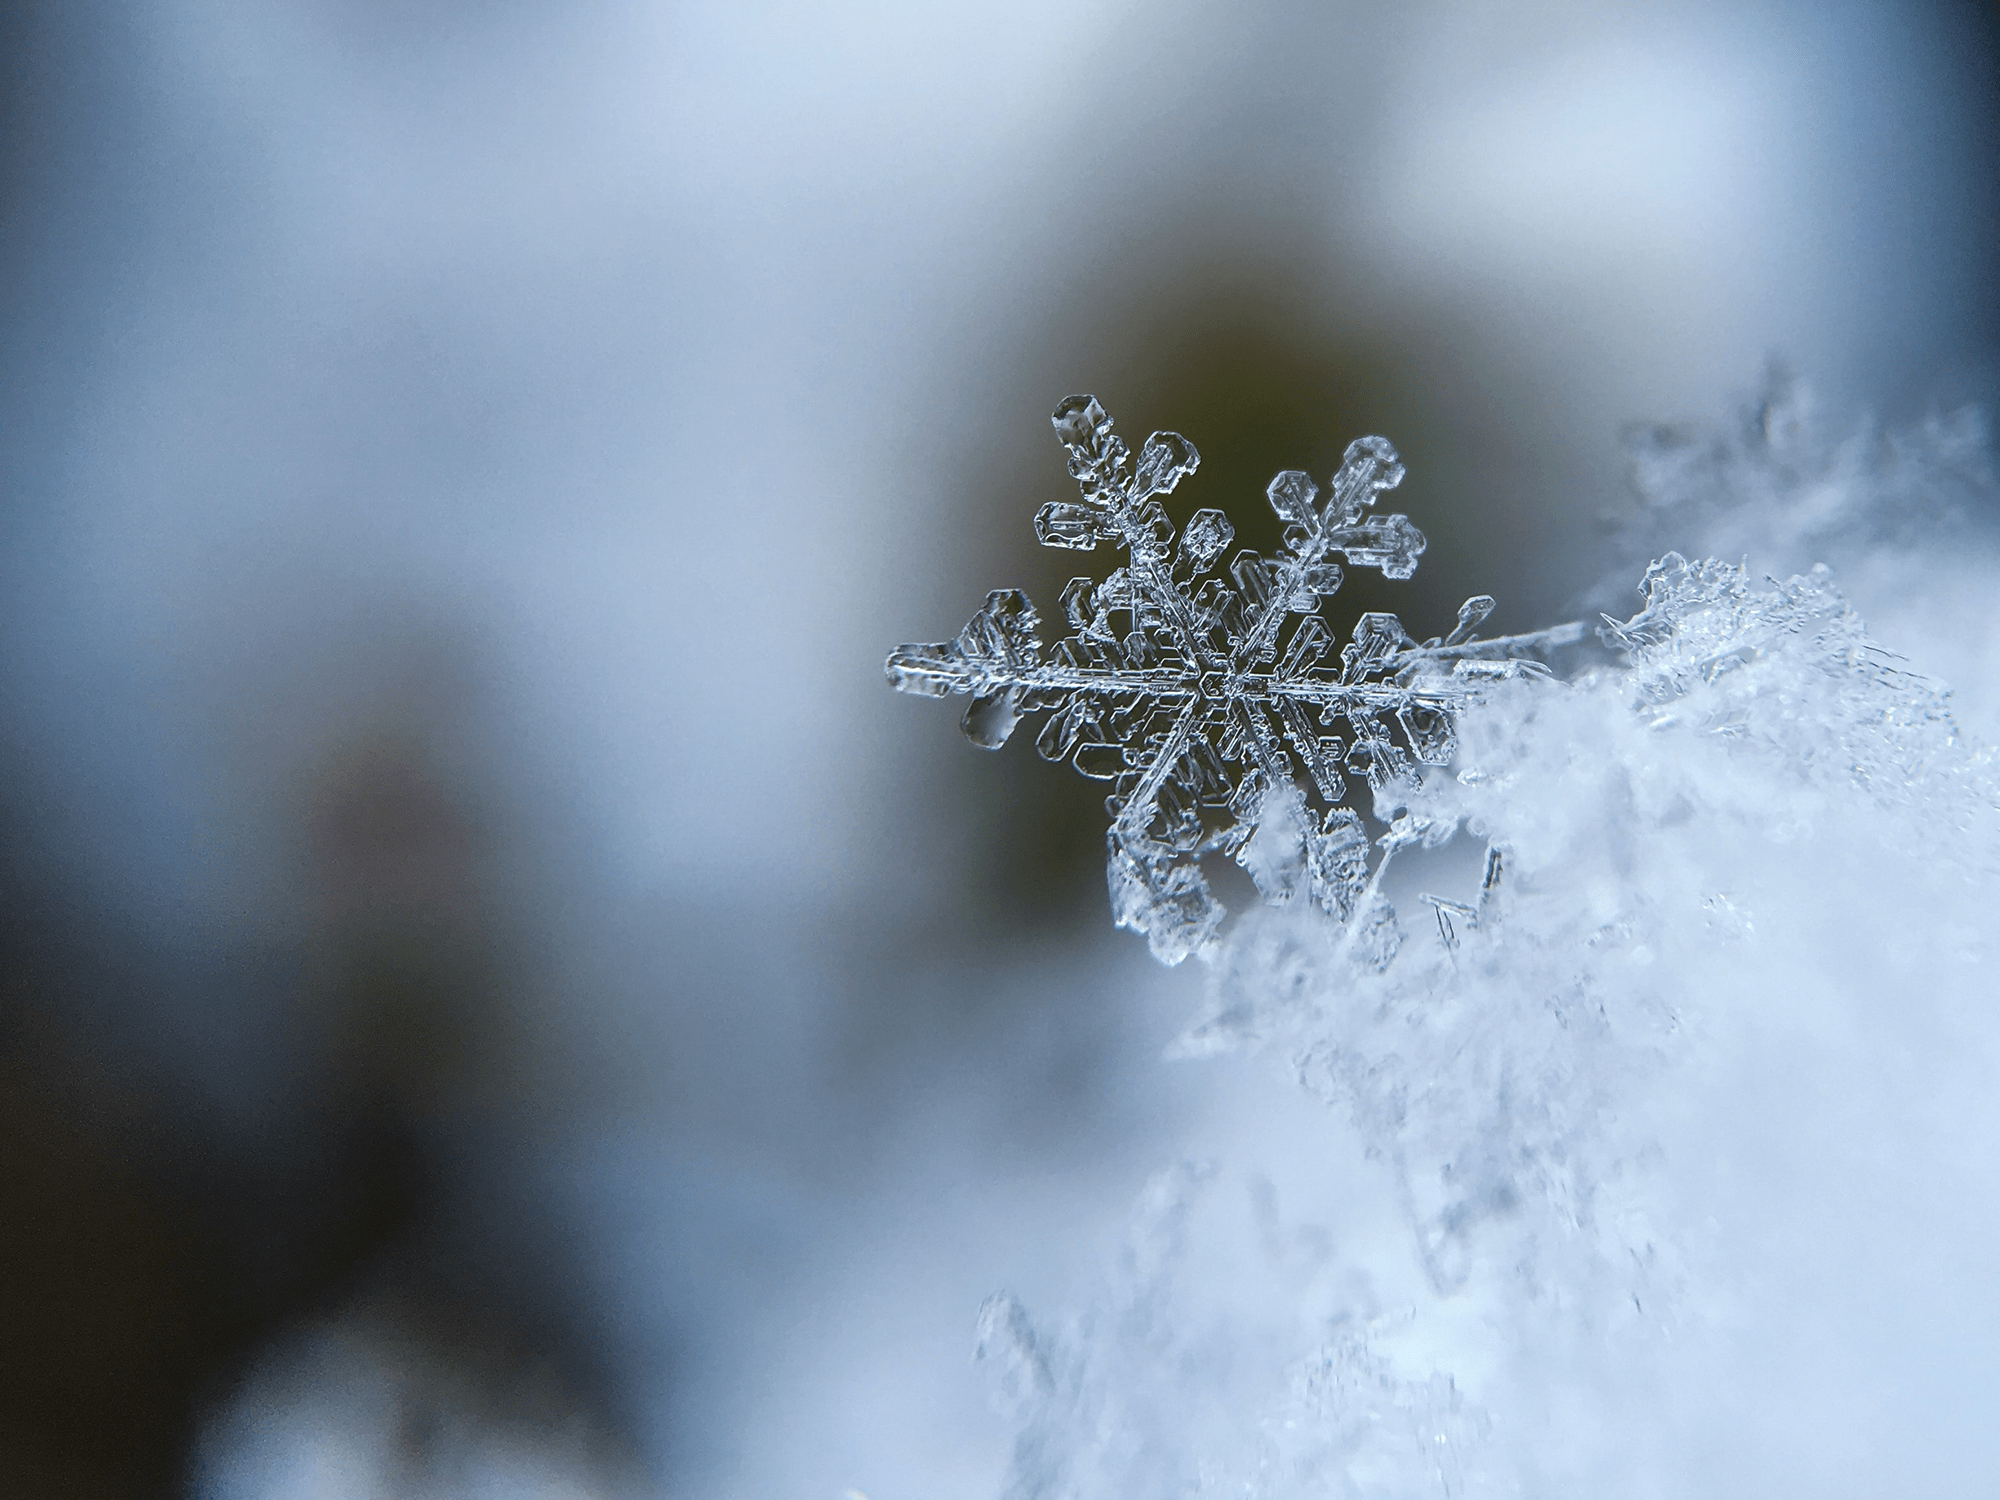
A football-shaped particle wobbles around its stable orientation as it falls through air. To account for that, researchers built a special apparatus that drops particles one-at-a-time through the field of view of four high-speed cameras. This setup gave them a narrow 1-mm band where they could track a falling particle’s orientation — provided the particle fell through the band, which happened about 20% of the time. Their results show that particles in air tumble and oscillate back and forth around their stable orientation more than in water experiments. This difference affects how quickly particles settle, which, in turn, affects how much they tend to clump and grow. (Image credit: snow – A. Burden, experiment – T. Bhowmick et al.; research credit: T. Bhowmick et al.; via APS Physics)

Modeling Wildfires With Water
Turbulence over a burning forest can carry embers that spread the wildfire. To understand how wildfire plumes interact with the natural turbulence found above the forest canopy, researchers modeled the situation in a water flume. Dowel rods acted as a forest, with turbulence developing naturally from the water flowing past. For a wildfire, the researchers used a plume of warmer water, which buoyancy lofted into the turbulence over their model forest.

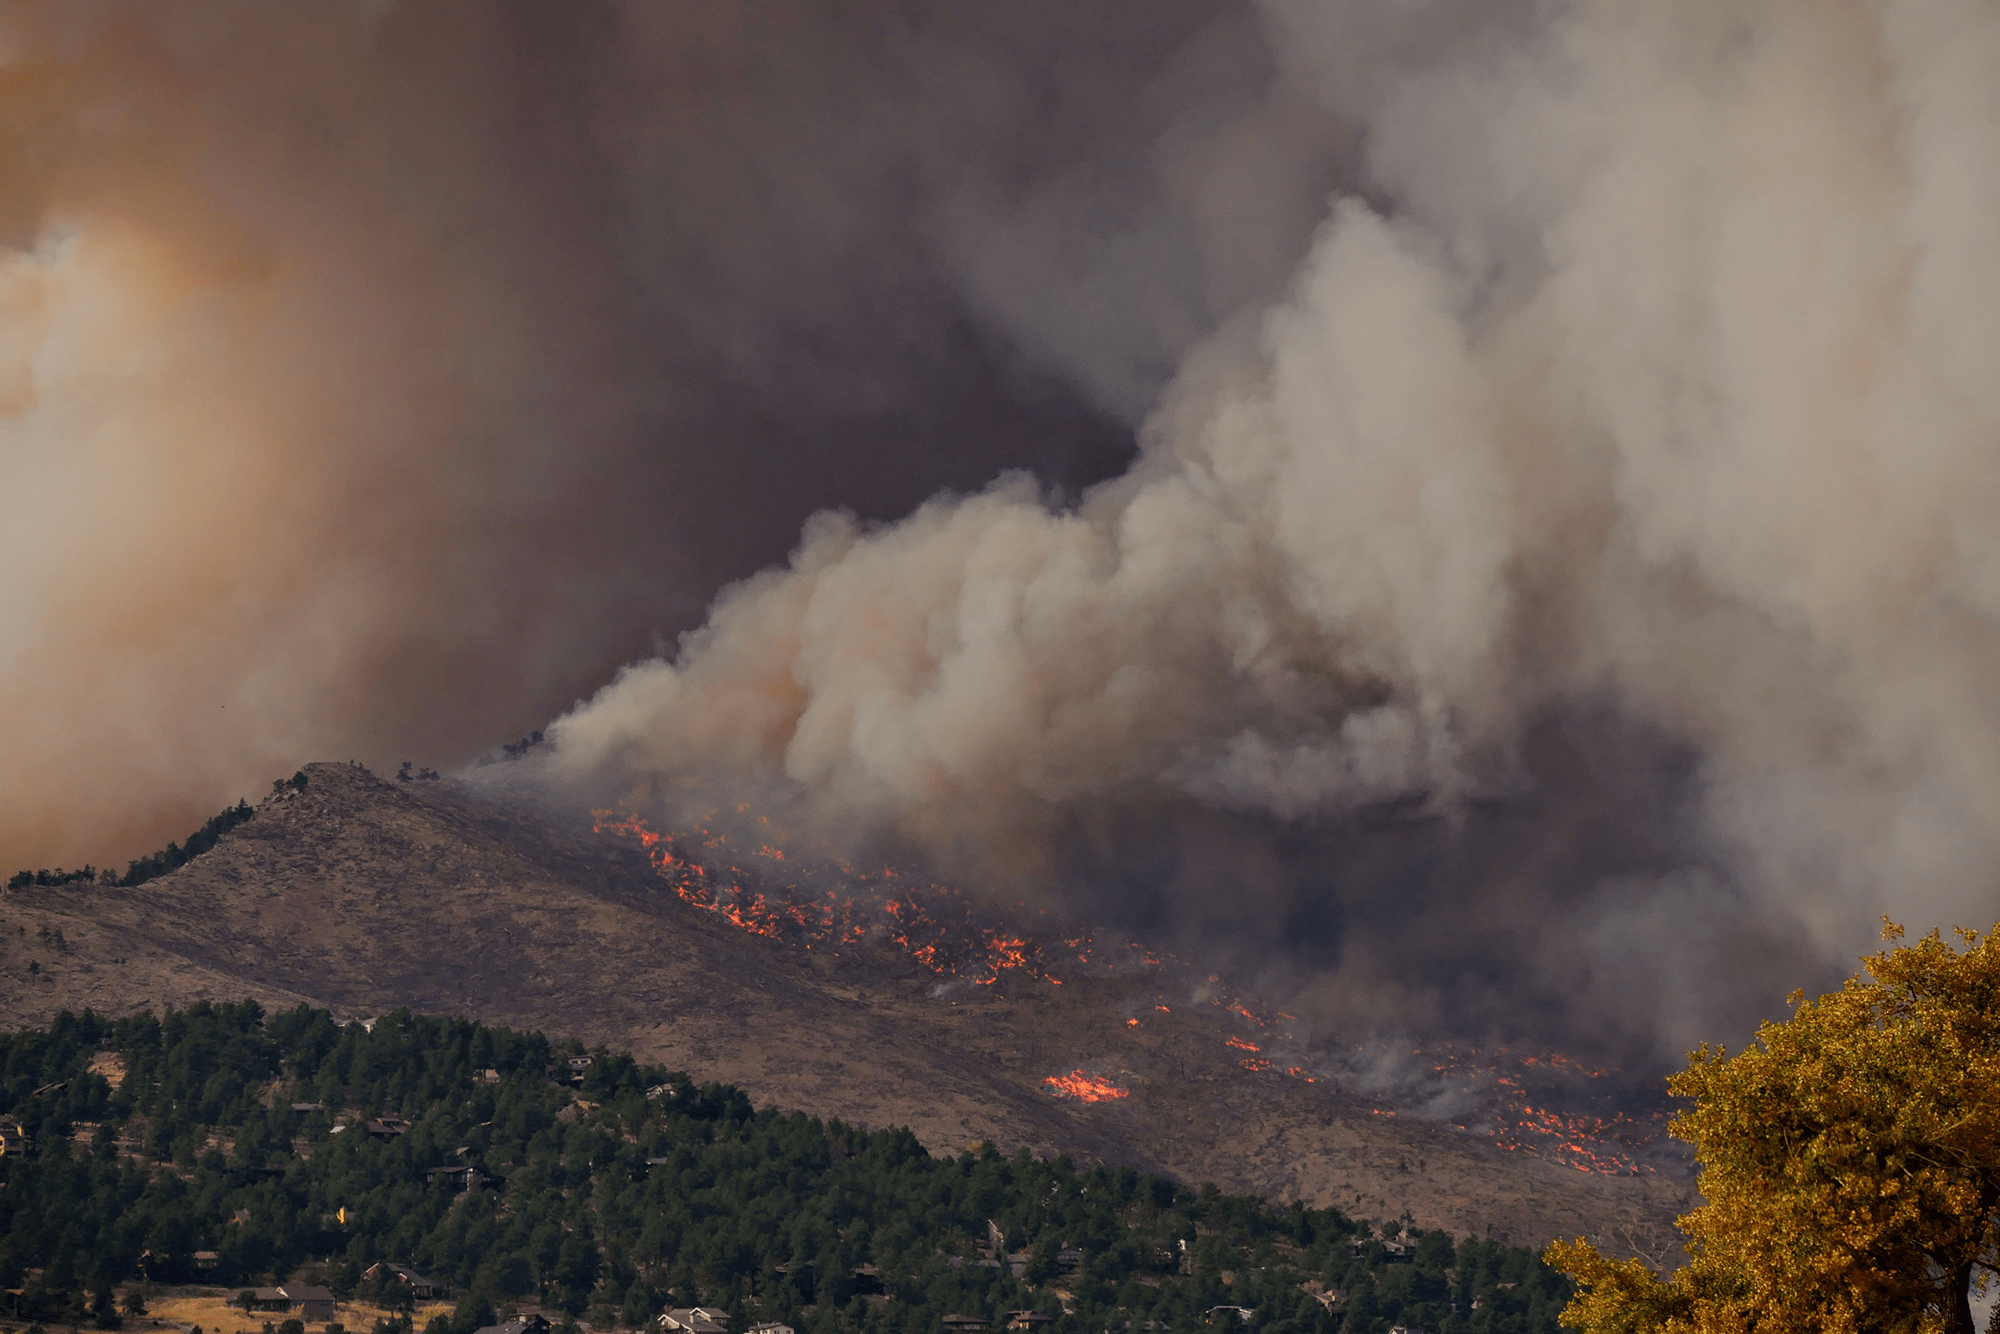
The experiment used to model wildfire flows. Dowel rods represent the forest and a plume of warm water (right side; distorting the background) represents the wildfire. The dark device in the foreground is a probe used to measure turbulence. The flow over the forest canopy naturally forms side-by-side rolls of air rotating around a horizontal axis. As the buoyant plume rises, it can be torn apart by these rollers, as well as carried downstream. Varying the turbulence, they found, did not affect the average trajectory of the plume. But the more intense the turbulence, the greater the vertical fluctuations in the plume. Those large variations, they concluded, could lift more embers into stronger winds that distribute them further and spread a fire faster. (Image credit: wildfire – M. Brooks, experiment – H. Chung and J. Koseff; research credit: H. Chung and J. Koseff; via APS Physics)

Testing Turbulence’s Limits
Understanding chaotic, turbulent flows has long challenged scientists and engineers due to their sheer complexity. In turbulent flows, energy cascades from the largest scales — like the kilometer-size cross-section of a cloud — to the very smallest scales, less than a millimeter in size, where viscosity transforms the flow’s motion to heat. For nearly a century, our theoretical understanding of turbulence has posited that there are certain universal behaviors in the statistics of a turbulent flow — essentially that, due to this energy cascade, some aspects of every turbulent flow are the same from clouds to ocean currents to your coffee cup.
Accordingly, experimentalists have tried for decades to measure this expected universality. Often, there are some signs of agreement, and any deviation was attributed to the finite difference between the large and small scales of the flow. (The theory assumes the difference in these scales’ size is effectively infinite.) But now researchers have achieved the largest range of scales yet — comparable to those found in the atmosphere — and the gaps between theory and experiment remain. The new study does show signs of universality but in a different way than existing theory predicts. As the authors point out, we’ll need new theories to explain these findings. (Image credit: D. Páscoa; research credit: C. Küchler et al.; via APS Physics)

The Optical Atom
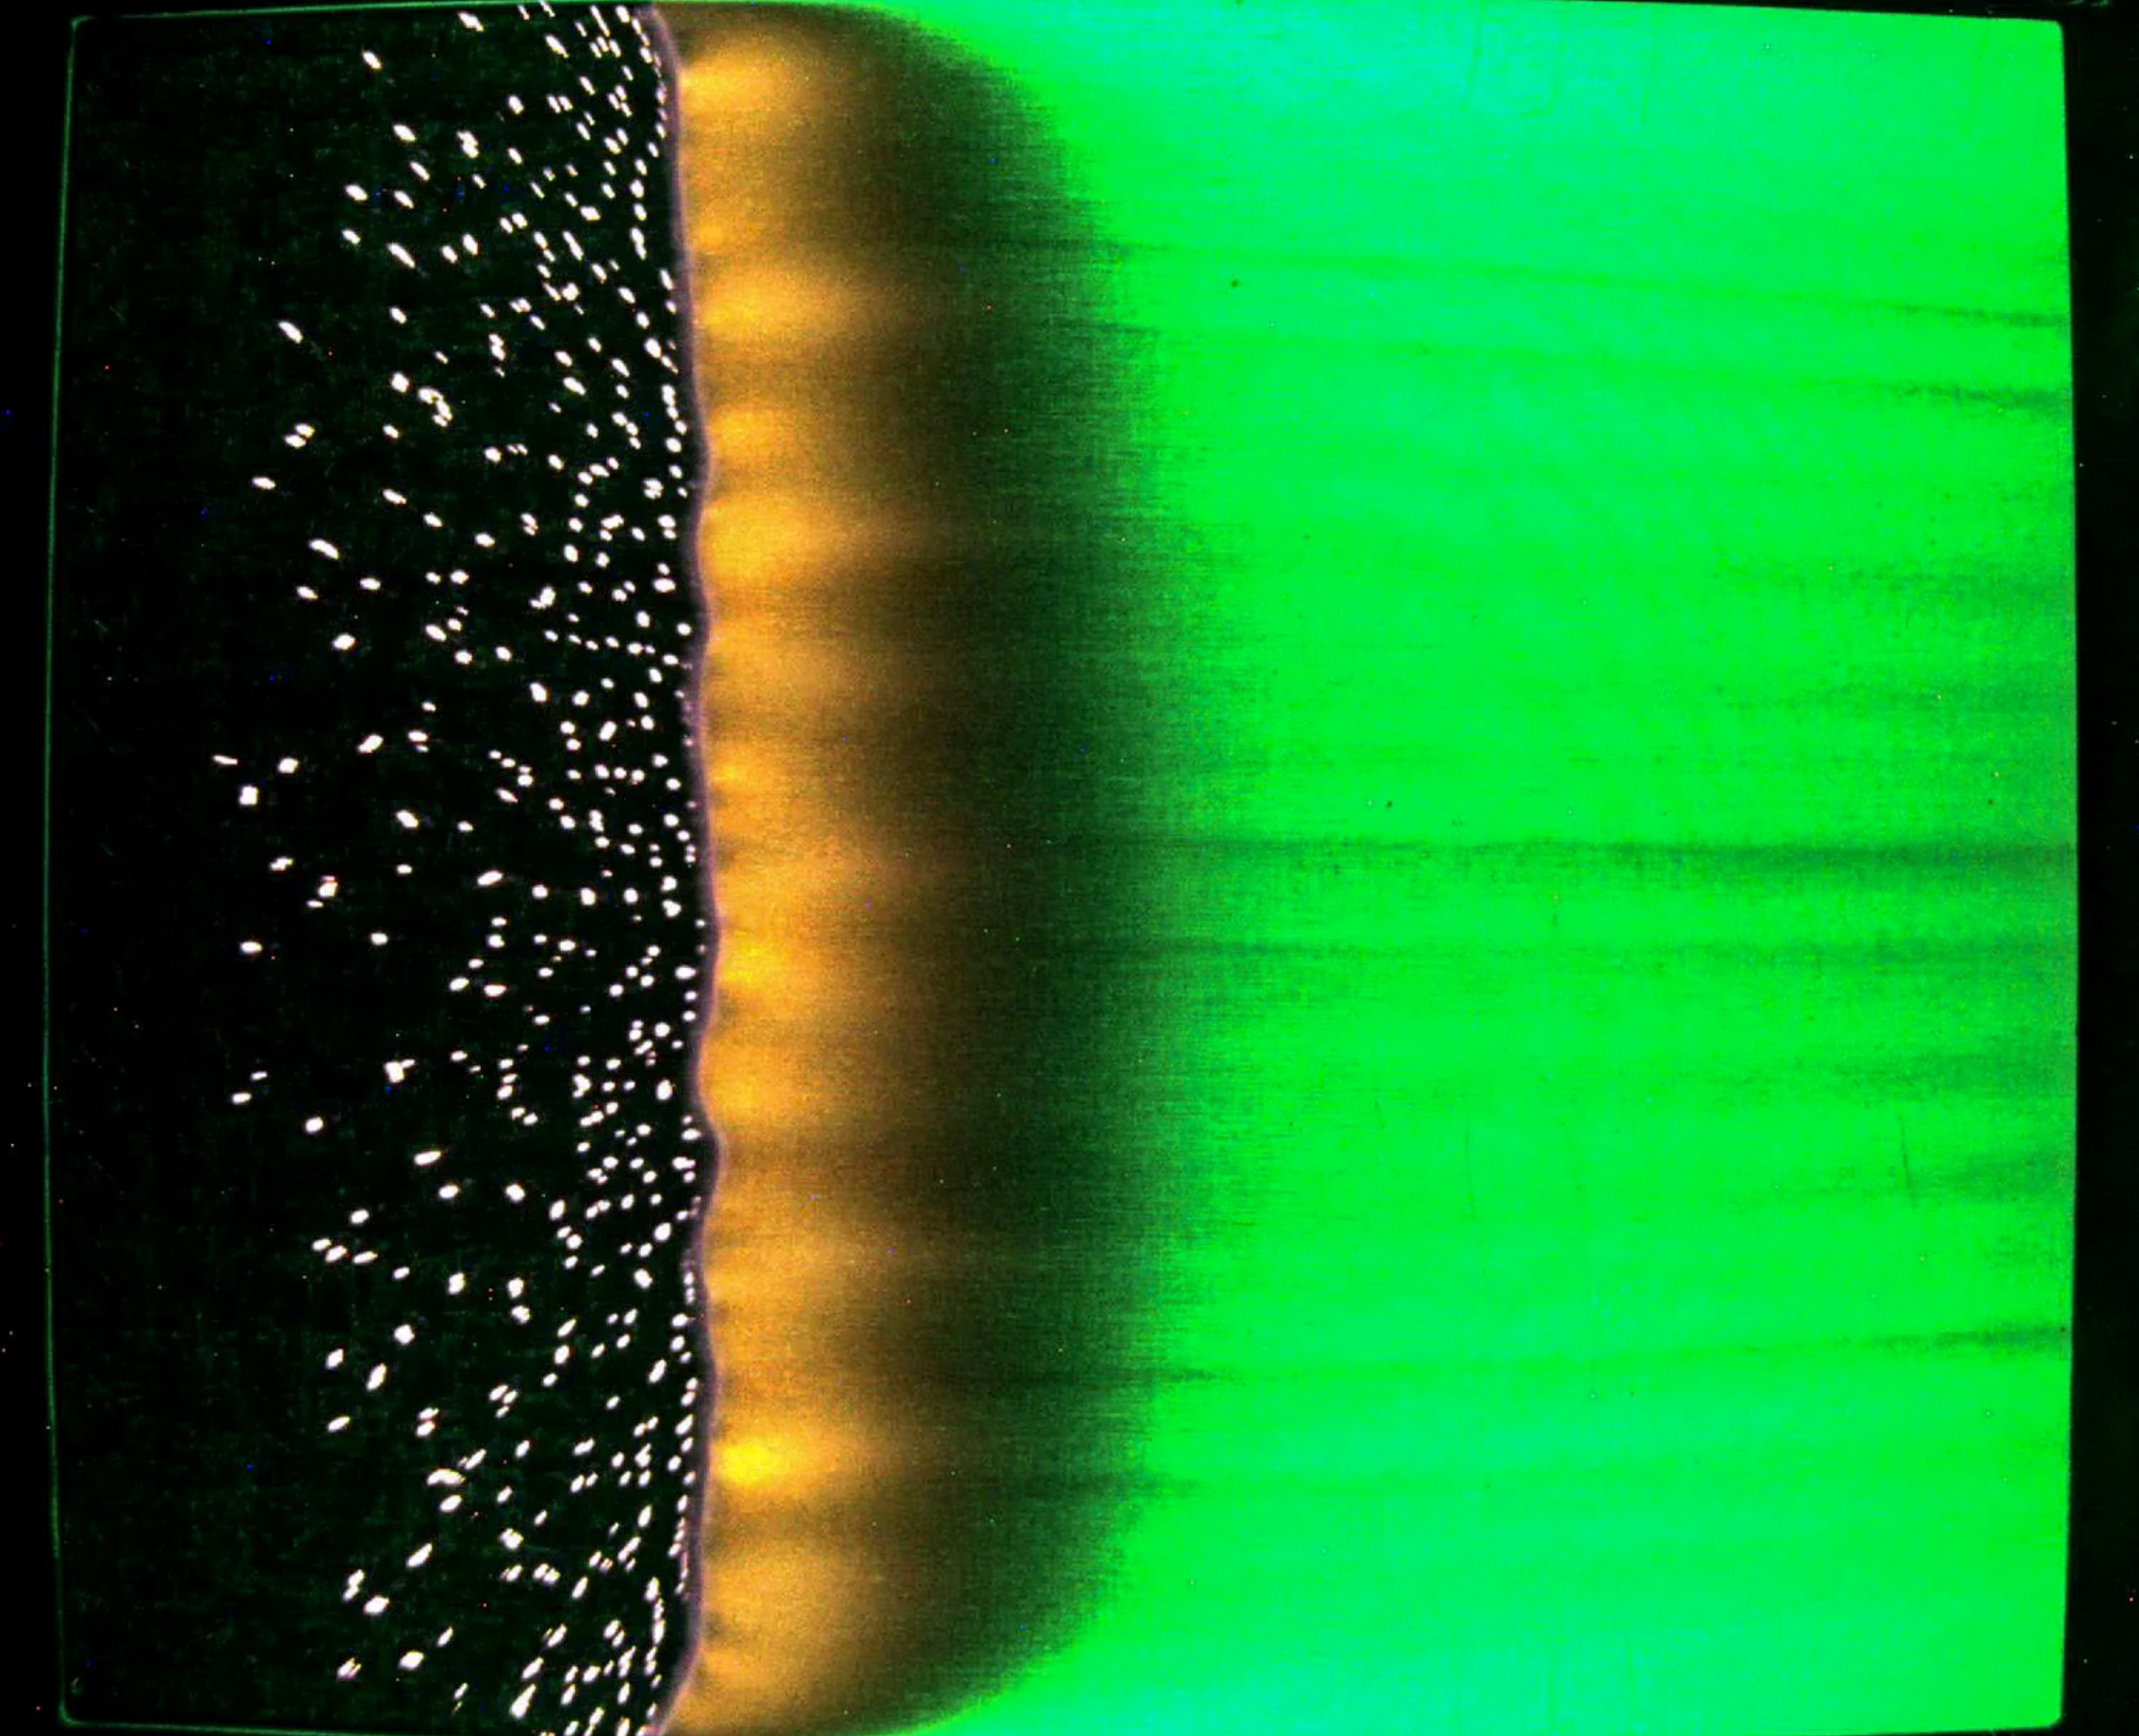
Researchers applied a quantum mechanical technique to study an evaporating drop in extreme detail. The team trapped a spherical water drop and collected the light scattered off it as it evaporated. Using an analytic technique originally developed for an atom, they were able to study changes in the drop down to the nanometric level without relying on numerical simulations to interpret the results. The authors suggest that their method is well-suited to studying the concentration of chemical or biological contaminants on the surface of a drop as it evaporates. (Image credit: droplet – Z. Kaiyv, Fano combs – J. Marmolejo et al.; research credit: J. Marmolejo et al.; via APS Physics)

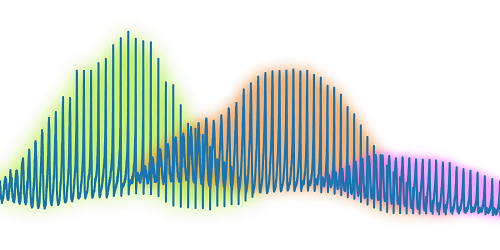
Illustration of the Fano combs seen by analyzing light scattered from an evaporating drop. 
Classifying Waves
In a lab, researchers create their waves in a long, clear-sided tank, where they can observe how the waves form, travel, and interact. To generate the wave, they use a plate, attached to a piston. Push the water at one end, and a wave forms. The type of wave that forms depends on both the velocity and the stroke length of the piston, as shown in this video. By mapping out these two variables, researchers can observe all different sorts of waves, from peaceful solitary waves to wild, plunging breakers. (Image and video credit: W. Sarlin et al.)


