Search results for: “vortex”

  • 10 Years of FYFD

    10 Years of FYFD

    10 years. 2,590 posts. 21 original videos. 378,000+ followers. Countless hours spent blogging and more than 1,000 journal articles read. When I started FYFD ten years ago as a PhD student, I never imagined the impact the blog would have on my life, my career, or my field. It’s been a wild ride, and I’d like to take a moment today to thank each and every one of you for contributing to this journey, whether it’s by supporting on Patreon, liking a post, sharing content, submitting ideas, leaving a comment, sending an email, or saying hi at an event. FYFD would have petered out long ago if not for your support!

    Ten years seems like a good time for a little retrospective, so I went back through the archive in search of the most popular post (based on Tumblr’s notes) from each of those ten years. Here’s what I found:

    Year 1: The Vortex Street
    Year 2: Wave Clouds Over Alabama
    Year 3: Surface Tension in Action
    Year 4: Why Honeycomb is Hexagonal
    Year 5: Bioluminescence
    Year 6: Self-Pouring Fluids
    Year 7: Watching Radiation
    Year 8: The Swimming of a Dead Fish
    Year 9: Seeing the Song
    Year 10: Collective Catfish Convection

    If you’d rather enjoy something random rather than something “popular”, you can always use the shortcut https://fyfluiddynamics.com/random to explore posts in the archive.

    And in case you’re more interested in watching videos, here are the top FYFD videos (by YouTube views):

    (Wow, my editing and production skills have evolved since some of those earlier vids!)

    So what are your favorite FYFD memories and posts? Let me know in the comments! (Image and video credits: N. Sharp)

  • Featured Video Play Icon

    The Eerie Singing of the Golden Gate Bridge

    Recent changes to the Golden Gate Bridge’s guardrails have created a new soundscape in the Bay Area. Under high winds, the bridge gives off an eerie, otherworldly wail that can be heard even miles away. The new guardrails are substantially thinner than the previous ones, which reduces the wind load the bridge has to endure. But that thinner profile is also what causes the noise, through a well-known phenomena known as vortex shedding.

    Vortex street animation.
    Animation of vortex shedding behind a cylinder. (Image credit: Wikimedia)

    As air moves past a non-streamlined body, like a cylinder, it forms counter-rotating vortices that peel off the body at a set frequency. Fluid dynamicists use a non-dimensional number, the Strouhal number, to characterize this vortex shedding. For a simple shape like a cylinder, the Strouhal number is relatively constant, so I decided to do a quick and dirty calculation to examine the wind velocities responsible for the sound. (See also my analysis of Star Trek Voyager’s opening sequence.)

    I began by collecting several videos with samples of the bridge’s singing (1, 2, 3). Then I used Adobe Audition to analyze the frequency content of the bridge noise. Below is a sample snapshot from a video taken on the bridge’s bike path, right next to the guardrail. The analysis shows three broad, but distinct peaks: a primary peak at 430 Hz, a small harmonic of that frequency at 860 Hz, and a separate, secondary peak centered at 1070 Hz. The broadness of the peaks, along with the competition between the primary and secondary peaks, is probably responsible for the disconcerting, discordant nature of the sound.

    Frequency analysis of the Golden Gate Bridge’s “singing”, taken from a section of this video. (Image credit: N. Sharp)

    Of the other videos I analyzed, a second video from near the bridge also showed the 430 Hz peak, while a video from further away had a dominant frequency of 517 Hz. There’s a lot of uncertainty introduced in not knowing exactly when each video was filmed, but given the agreement between videos 2 and 3, I suspect that video 1’s higher frequency may be caused by interference and modulation as the sound travels.

    With the major frequency in hand, I estimated the size of the new guardrail wires as 10mm in diameter. After some tweaking to adjust the Reynolds number and Strouhal numbers, that gave me an estimated wind speed of 21 meters per second, or about 47 miles per hour. That’s right in line with the 43 miles per hour discussed by the news anchors.

    What if the guardrails are a little thinner? If the wires are about 7.5 mm in diameter, then it only takes winds at about 15 meters per second (34 miles per hour) to create that 430 Hz note.

    Keep in mind that this analysis doesn’t predict the minimum wind speed needed to create the audible noise; all I’m able to do is a back-of-the-envelope calculation of what the likely wind speed was when a video was recorded. Nevertheless, I hope you’ll find it interesting! (Video credit: KPIX CBS News; image credits: vortex shedding – Wikimedia, frequency analysis – N. Sharp; submitted by Christina T.)

  • The Naruto Whirlpools

    The Naruto Whirlpools

    Enormous whirlpools are not simply the work of overactive imaginations. There are several spots in the world, including Japan’s Naruto Strait, that regularly see these spectacular vortices.

    Naruto’s whirlpools are formed through the interaction of tidal currents with the local topography. Spring tides funneled through the vee-shaped strait can reach speeds of 20 kph as they rush between the Pacific Ocean and the Inland Sea. Below the surface, there’s also a deep depression that helps bring the tides together in such a way that it generates vortices 20 meters in diameter.

    In normal times, the whirlpools are a significant tourist attraction during the springtime. Travelers can view them from tour boats, helicopters, and from the Onaruto Bridge. (Image credits: whirlpools – Mainichi/N. Yamada, Discover Tokushima; artwork: Hiroshige; via Mainichi; submitted by Alan M.)

  • Listening to a Bubble’s Pop

    Listening to a Bubble’s Pop

    Sound is an important aspect of many flows, from the scream of a rocket engine to the hum of electrical wires vibrating in the wind. Critically, those sounds carry important information about the flow. A new study extends these acoustic diagnostics to the popping of soap bubbles.

    When a hole opens in a soap bubble, it throws the surface-tension-driven capillary forces of the bubble into disarray. The rim around the hole retracts, pushing fluid away from the expanding hole. At the same time, air is pushed out of the collapsing bubble. Using microphone arrays, the researchers found they could measure and distinguish sound from both sources — the escaping air and the expanding hole.

    From the sound, they developed a model that predicts the rupture location, bubble thickness profile, and other properties of the bubble. They confirmed the model’s results by comparing with high-speed photography. The authors hope their new acoustic technique will shed light on bubble bursting events that are hard to observe visually, like the bubbling of magma. (Image and research credit: A. Bussonnière et al.; via Science News; submitted by Kam-Yung Soh)

  • Watery Suction Enables Spiderman-Like Climbing

    Watery Suction Enables Spiderman-Like Climbing

    Spiderman makes it look easy, but sticking to surfaces with enough force to climb them is a challenge at the human scale. These researchers tackled the problem with a new method of suction. Traditional suction devices are limited by their ability to seal at the edges. Any surface roughness that prevents a perfect seal creates a leak and fighting those leaks to maintain vacuum pressure requires larger and more powerful pumps.

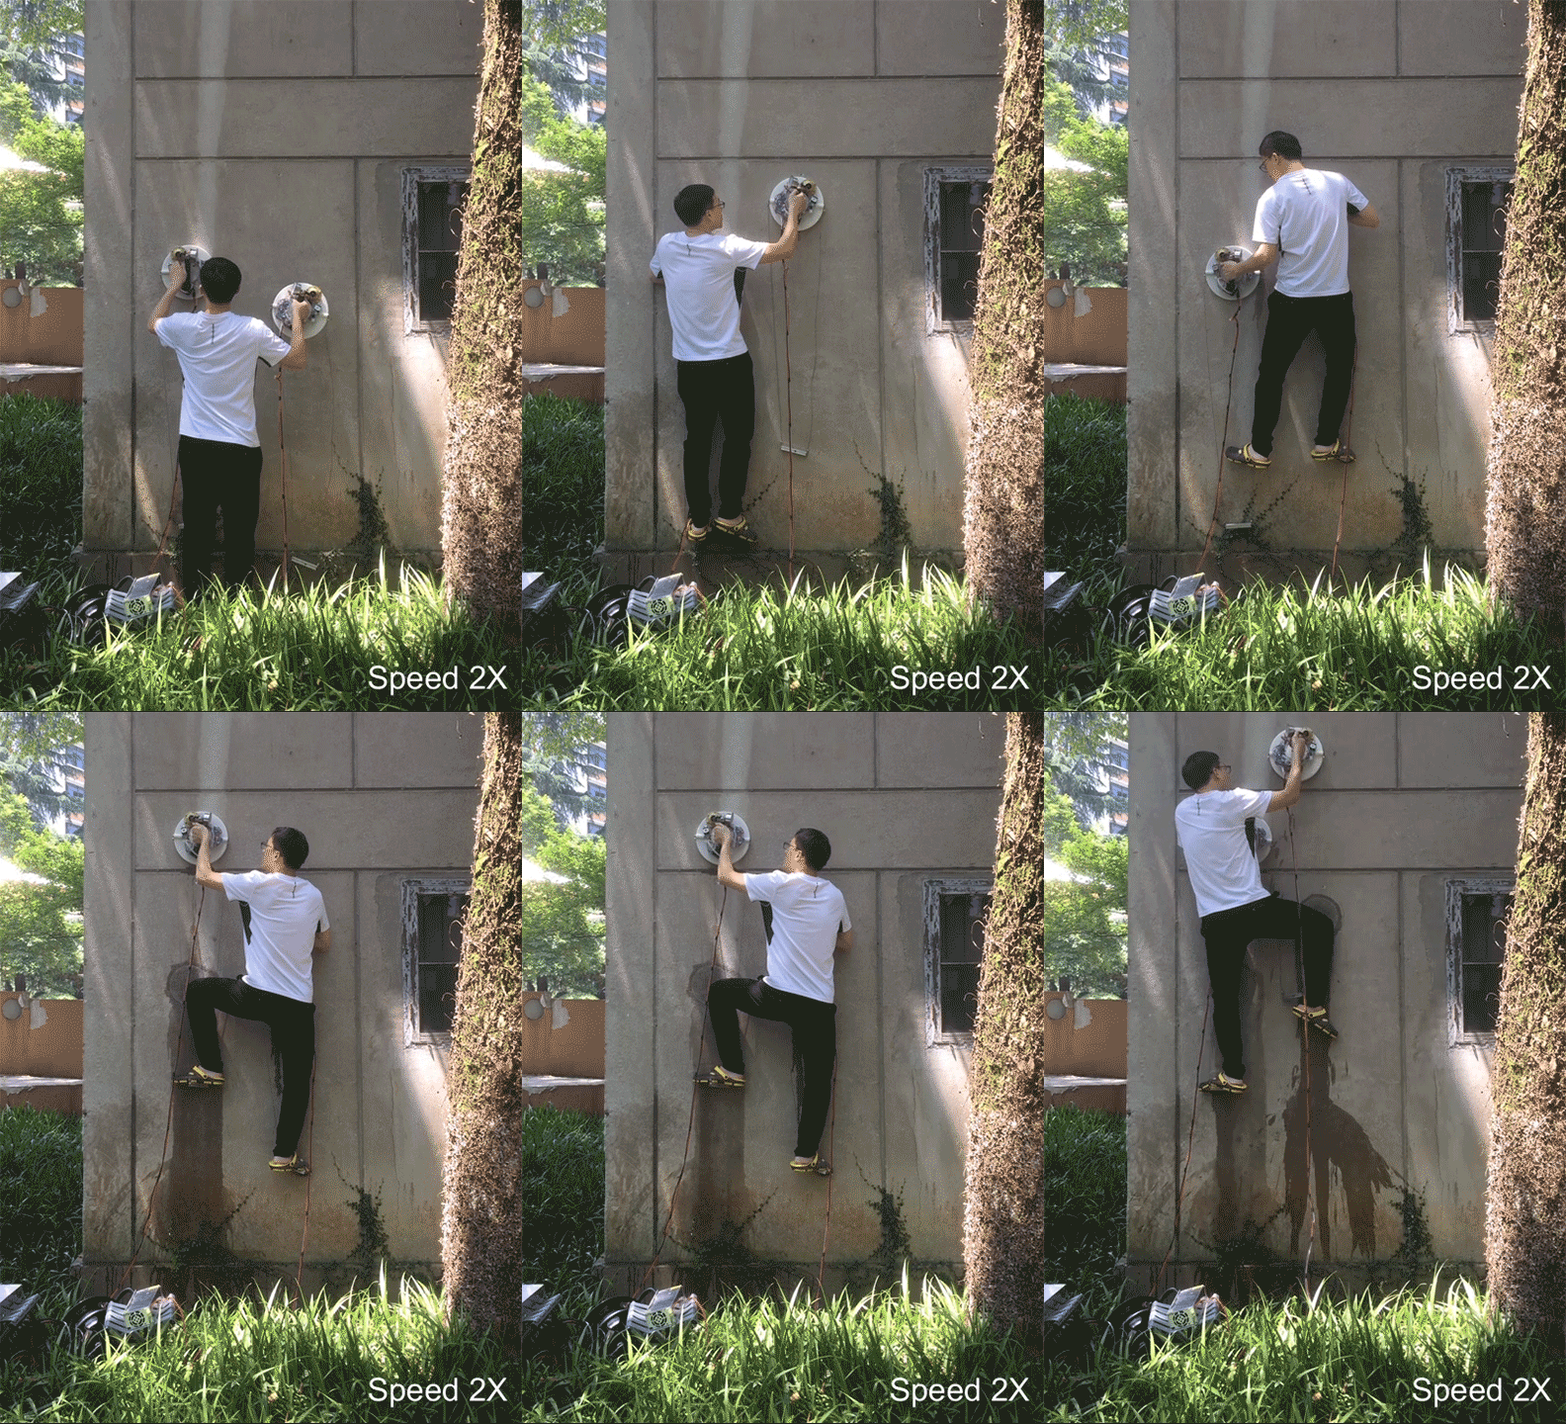
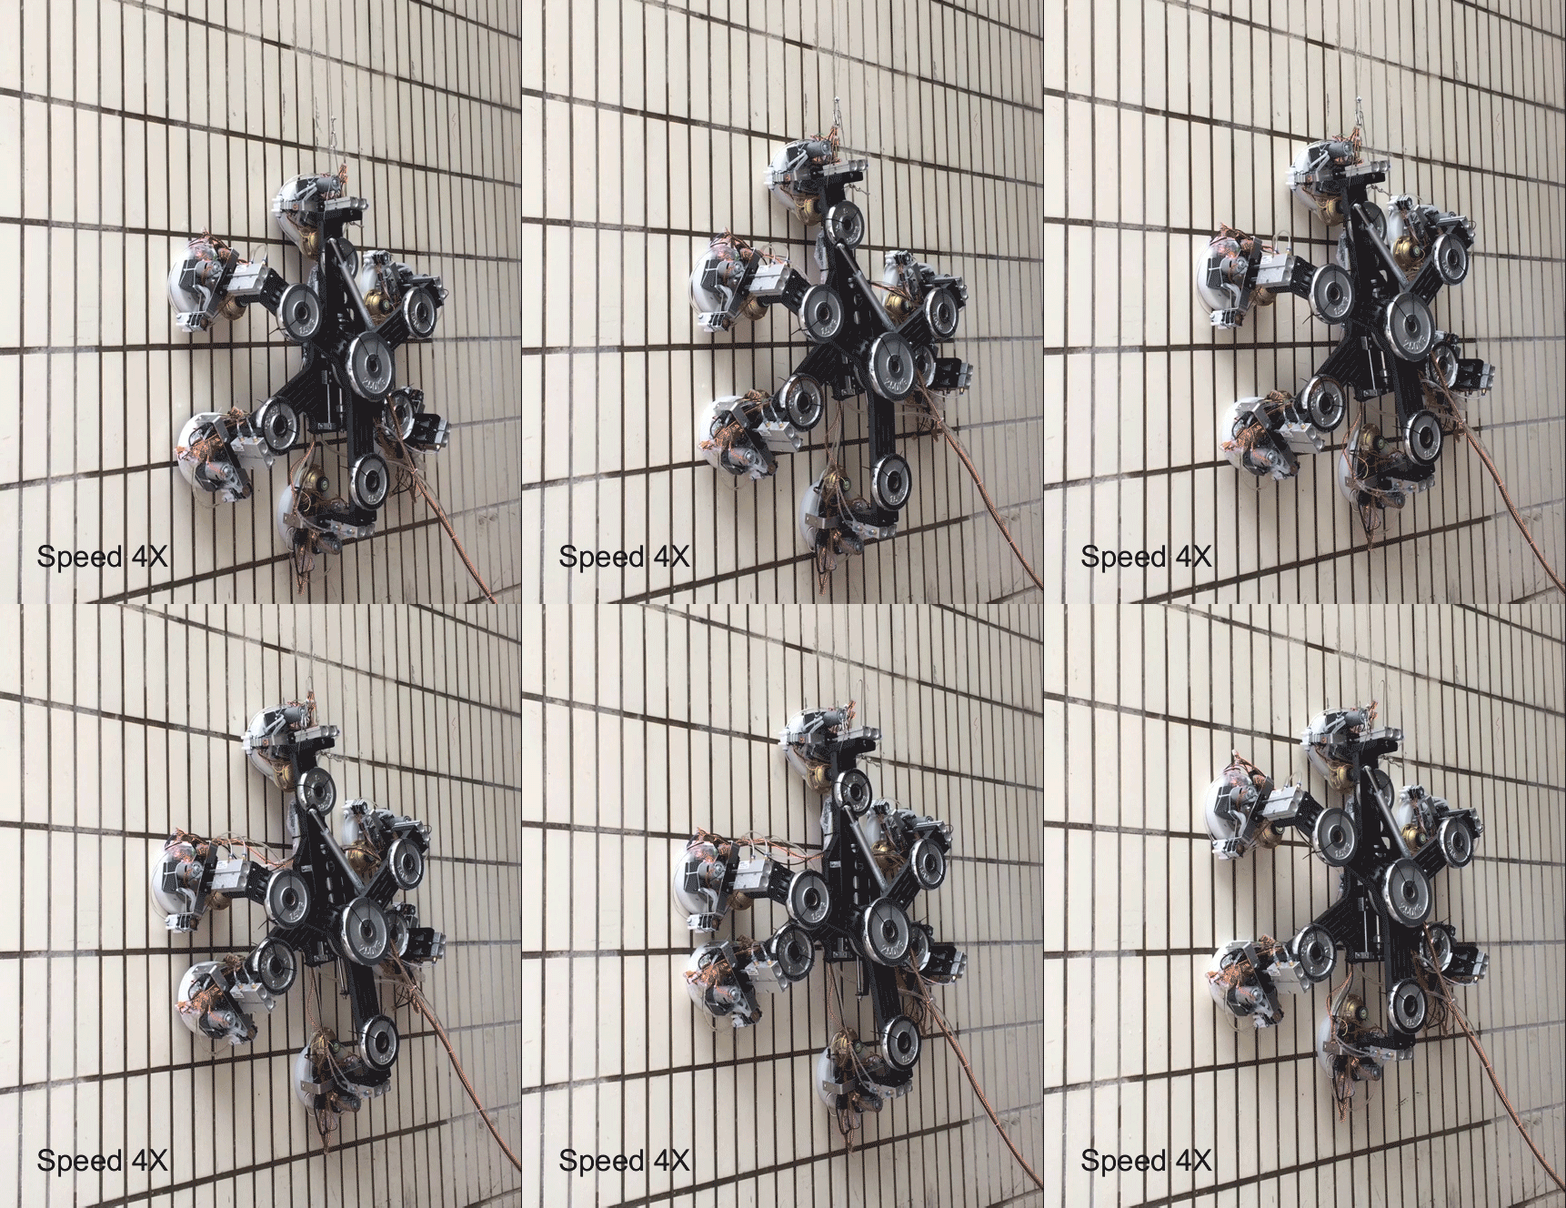
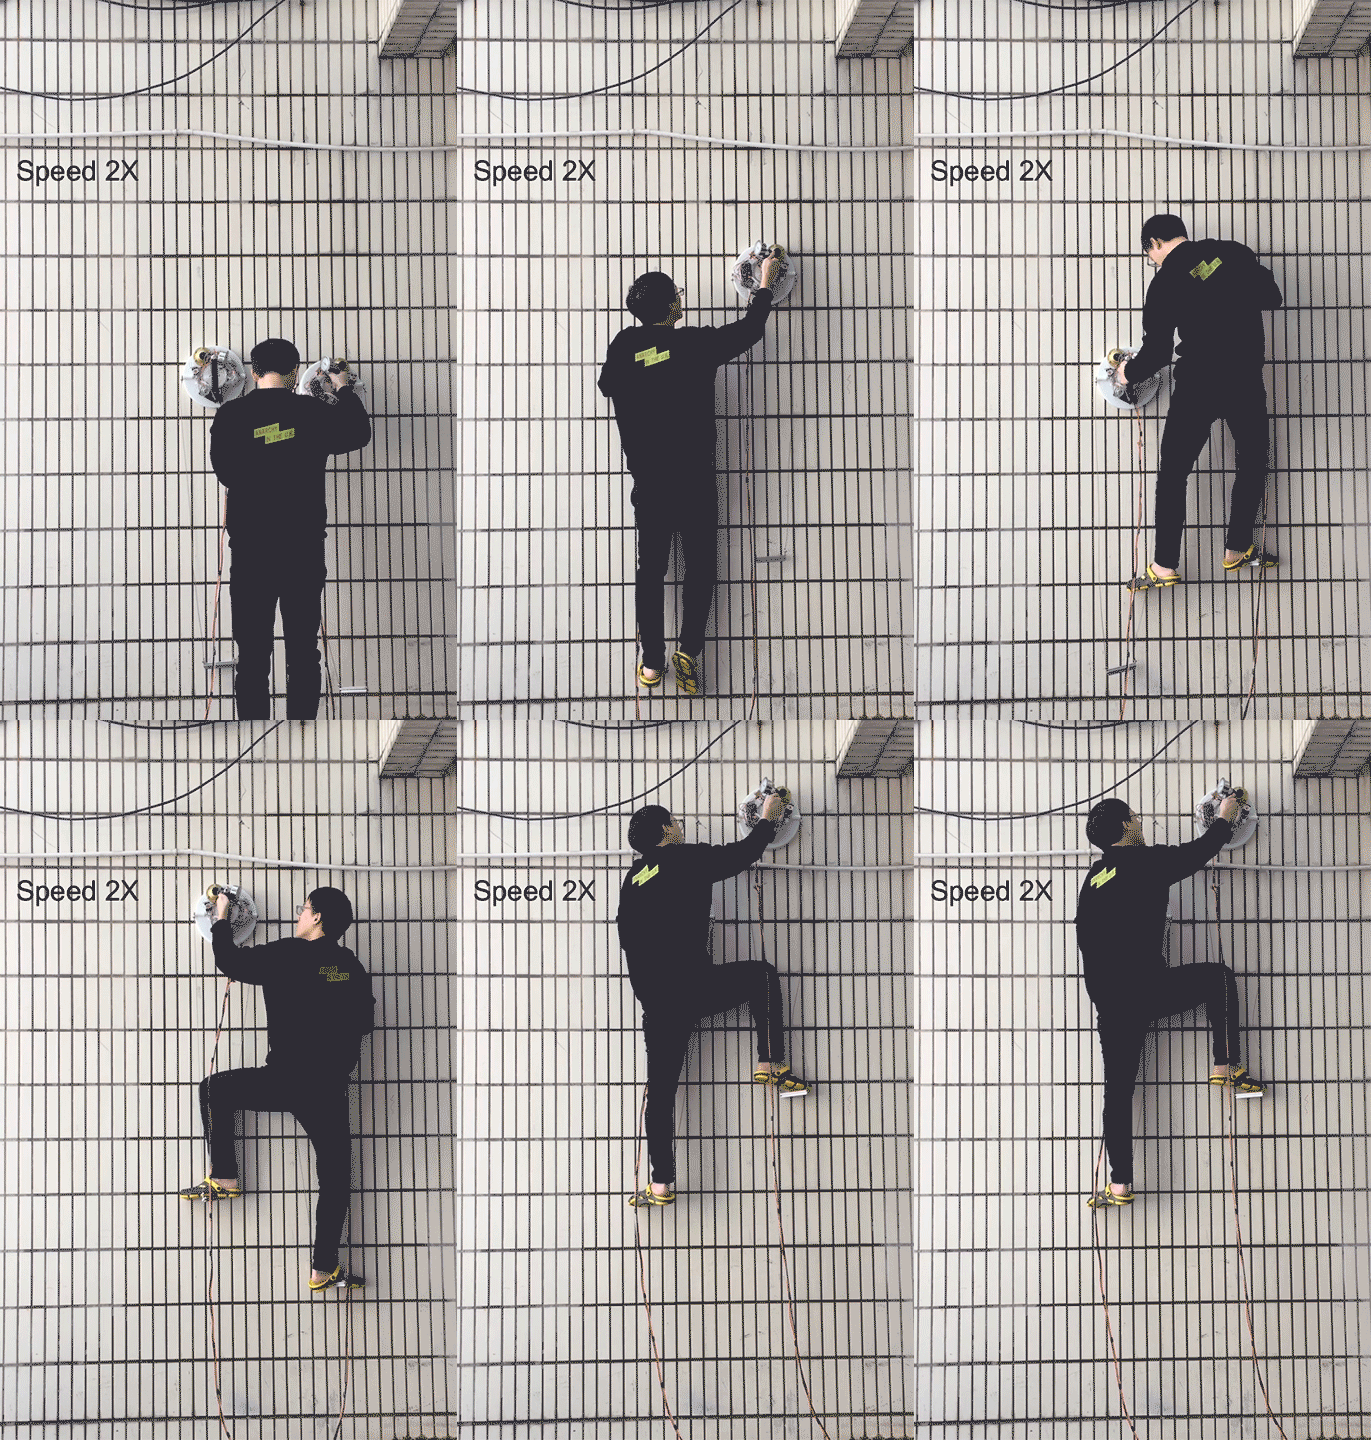
    In this work, the researchers essentially eschew a solid sealing mechanism for a liquid one. A fan inside each suction cup creates a spinning ring of water along the seal’s boundary that allows it to conform even to very rough surfaces without losing vacuum pressure. The researchers demonstrate the principle in action with a hexapod wall-climbing robot as well as with human-scale climbing systems.

    But don’t plan your web-slinging adventures just yet! As you can see on the concrete wall example, the system leaks a lot of water, especially when disengaging the suction. Right now, you can only climb as far as your water supply allows. (Image and research credit: K. Shi and X. Li; via Spectrum; submitted by Kam-Yung Soh)

  • The Best of FYFD 2019

    The Best of FYFD 2019

    2019 was an even busier year than last year! I spent nearly two whole months traveling for business, gave 13 invited talks and workshops, and produced three FYFD videos. I also published more than 250 blog posts and migrated all 2400+ of them to a new site. And, according to you, here are the top 10 FYFD posts of the year:

    1. The perfect conditions make birdsong visible
    2. Pigeons are impressive fliers
    3. The water anole’s clever method of breathing underwater
    4. 100 years ago, Boston was flooded with molasses
    5. The BZ reaction is some of nature’s most beautiful chemistry
    6. The labyrinthine dance of ferrofluid
    7. 360-degree splashes
    8. The extraordinary flight of dandelion seeds
    9. Dye shows what happens beneath a wave
    10. Bees do the wave to frighten off predators

    Nature makes a strong showing in this year’s top posts with five biophysics topics. FYFD videos also had a good year: both my Boston Molasses Flood video and dandelion flight video made the top 10!

    If you’d like to see more great posts like these, please remember that FYFD is primarily supported by readers like you. You can help support the site by becoming a patronmaking a one-time donation, or buying some merch. Happy New Year!

    (Image credits: birdsong – K. Swoboda; pigeon take-off – BBC Earth; water anole – L. Swierk; Boston molasses flood – Boston Public Library; BZ reaction – Beauty of Science; ferrofluid – M. Zahn and C. Lorenz; splashes – Macro Room; dandelion – N. Sharp; dyed wave – S. Morris; bees – Beekeeping International)

  • Robotic Research Facilities

    Robotic Research Facilities

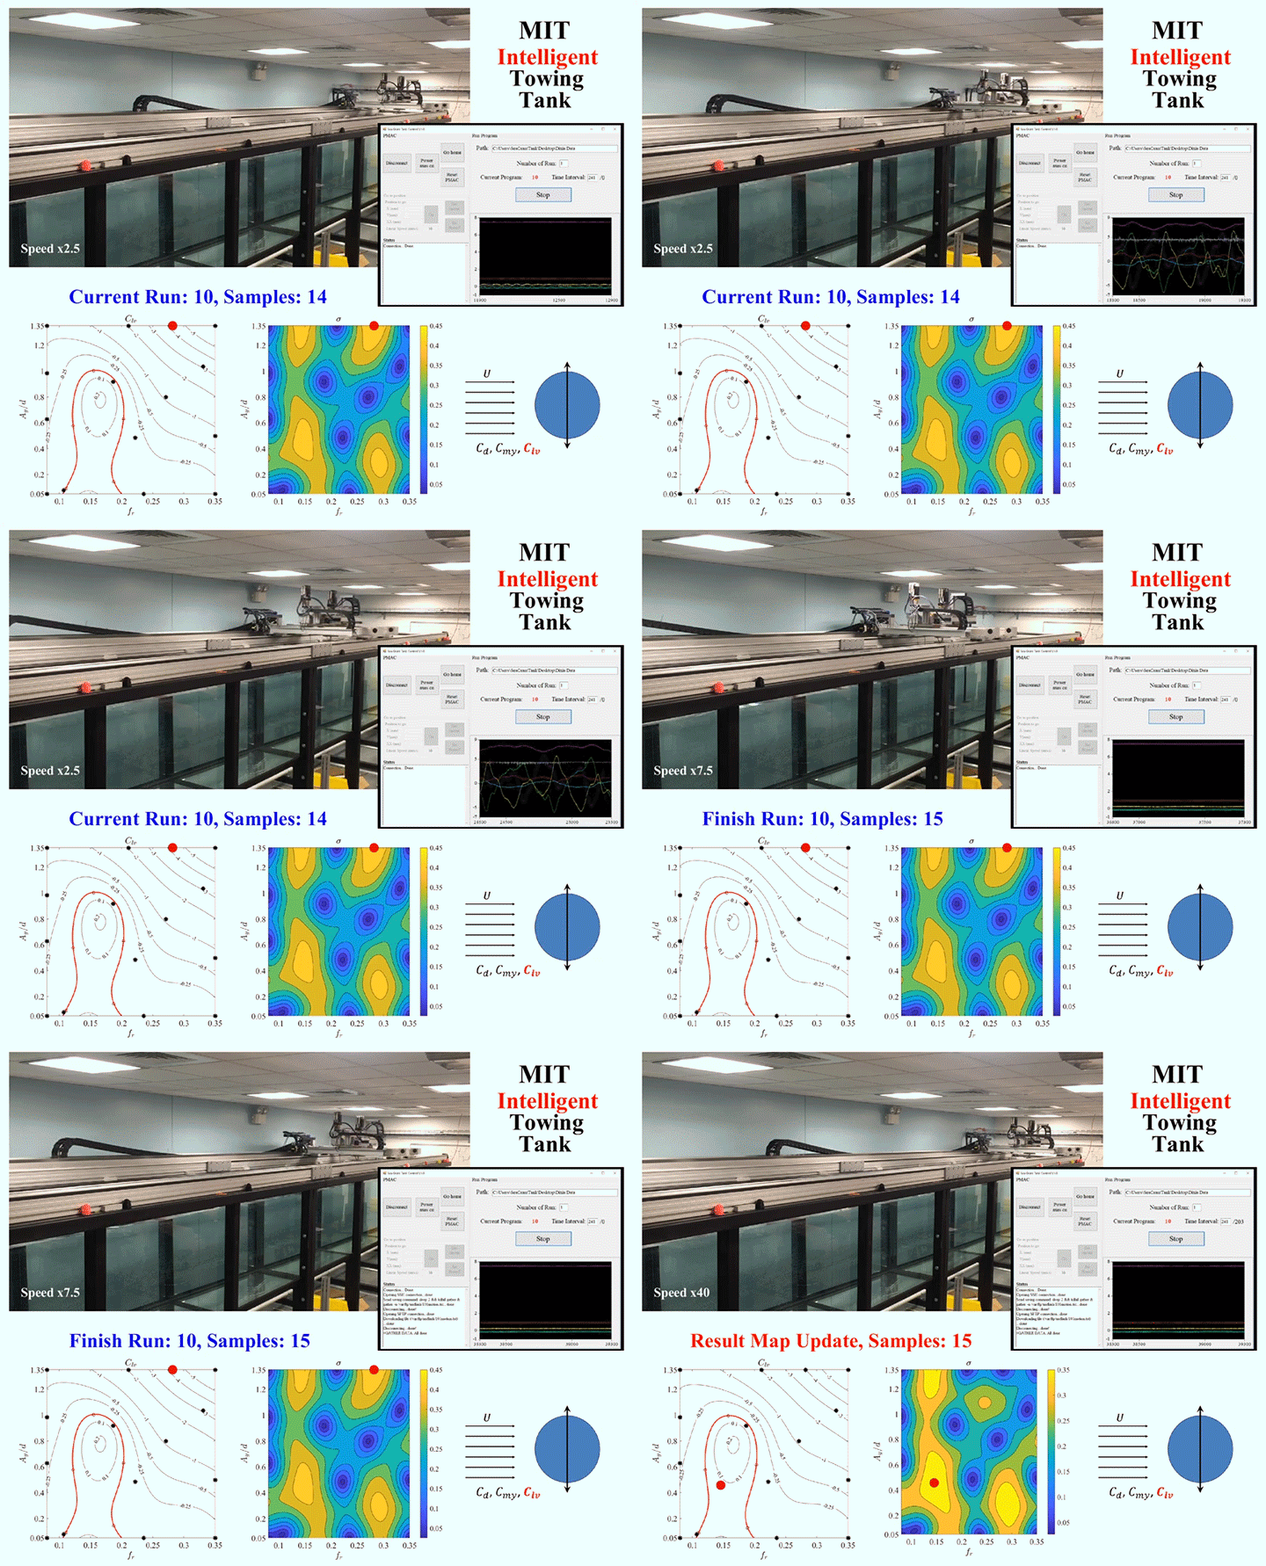
    One of the major challenges in fluid dynamics is the size of the parameter spaces we have to explore. Because many problems in fluid dynamics are non-linear, making small changes in the initial set-up can result in large differences in the results. Consider, for example, a simple cylinder towed through a water tank. As the cylinder moves, vortices will form around it and shed off the back, causing the cylinder to vibrate. The details of what will happen will depend on variables like the cylinder’s size and flexibility, the speed it’s being towed at, and which directions it’s allowed to vibrate in. Mapping out the parameter space, even sparsely, could take a graduate student hundreds of experiments.

    To speed up this process, engineers are now building robotic facilities like the Intelligent Towing Tank (ITT) shown above. Like graduate students, the ITT can work into the wee hours of the night, but, unlike graduate students, it never needs to eat, sleep, or stop experimenting. Now, one could use a facility like this to brute-force the answers by testing every possible combination of parameters, but even working 24 hours a day, that would take a long time. Instead, researchers use machine learning to guide the robotic facility into choosing test parameters in a way that optimizes the factors the researchers define as important.

    Essentially, the system starts with experiments chosen at random within the parameter space, and then uses those results to select areas of interest until it’s gathered enough data to satisfy the limits specified by human researchers. In theory, a well-designed algorithm can dramatically reduce the number of experiments needed to explore a parameter space. (Image and research credit: D. Fan et al.; submitted by Kam-Yung Soh)

  • Jovian Vortices

    Jovian Vortices

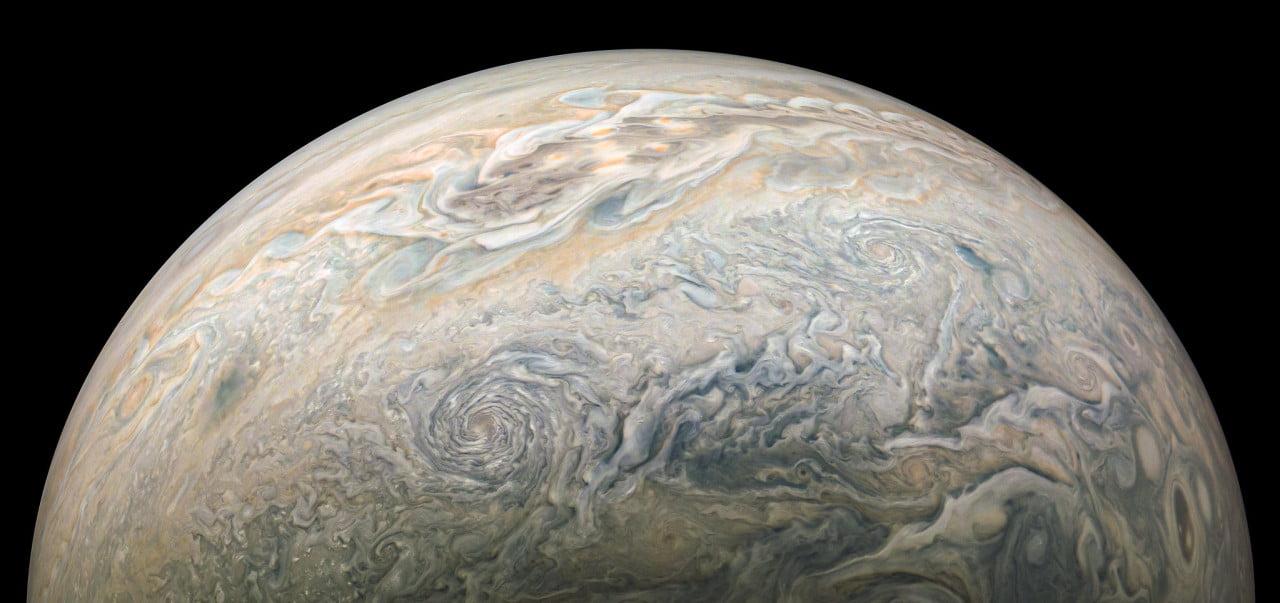
    Jupiter continues to mesmerize in the images from JunoCam. With enhanced contrast, the planet’s eddies look like swirls you could just lean forward and fall into. The complexity of the Jovian atmosphere’s mixing is just astounding. It’s like an ever-changing Impressionist painting brought to life. Check out full-size versions of these stunning images here and here. (Image credit: NASA/JPL-Caltech/SwRI/MSSS/Kevin M. Gill, 12; via Planetary Society; submitted by jpshoer)

  • Trails from a Delta Wing

    Trails from a Delta Wing

    Top-down view of green and red dyes streaming off a delta wing

    Rhodamine (red) and fluorescein (green) dyes highlight the complex flows around a delta wing. To visualize the flow, researchers painted the apex of the delta wing with rhodamine, which gets drawn into the core of the wing’s leading edge vortex. The green fluorescein dye was added to the wing’s trailing edge, where it gets pulled into the secondary structure of the vortices. A laser illuminates the flow, making even the most delicate wisps of dye shine. As the wake behind the wing develops, the dyes reveal growing instabilities along the vortices. Given time and space, these instabilities will grow large enough to destroy any order in the wake, leaving behind turbulence. (Image and research credit: S. Morris and C. Williamson; see also poster)

  • Nighttime Streets

    Nighttime Streets

    Clouds spiral behind the islands of Tenerife and Gran Canaria in this nighttime satellite imagery. Although it’s not entirely unusual to see these von Karman vortex street clouds in the wakes of islands, this is the first time I’ve seen them at night. They form when winds off the ocean are forced up and around rocky islands. Like air moving past a cylinder, the flow forms a swirling vortex off one side of the island, which separates and moves downstream while another forms on the island’s opposite side. When the resulting flow mixes with a cloud layer, we can see the pattern from space. (Image credit: J. Stevens; via NASA Earth Observatory)