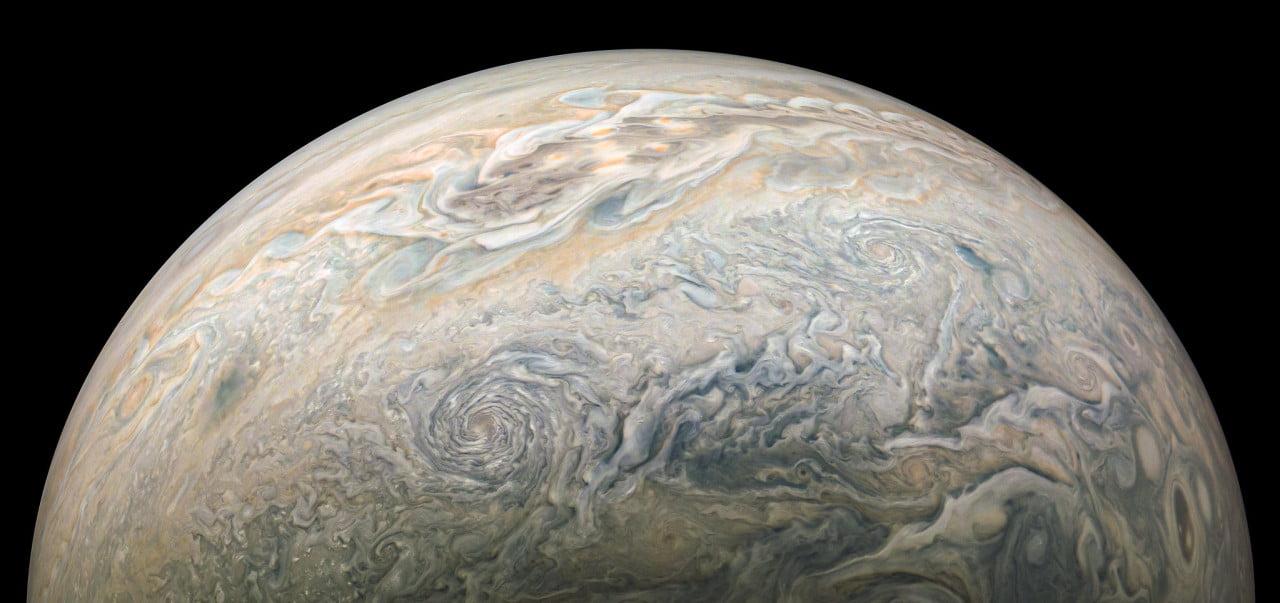
Jupiter, our solar system’s stormiest planet, shares many similarities with Earth. But where Earth’s strongest storms are cyclones centered on low-pressure regions, Jupiter’s longest and strongest storms are anti-cyclones, driven by areas of high pressure. They’re often massive — larger than the entire Earth — and persist for weeks, months, or years. This processed image comes from the JunoCam instrument and shows some of the incredible cloud structure in Jupiter’s atmosphere. Jupiter’s highest altitude clouds tend to be the lightest, while darker clouds remain lower. (Image credit: NASA/JPL-Caltech/SwRI/MSSS/K. Gill; via APOD)
Tag: Juno

Stabilizing Jupiter’s Polar Storms
Four years ago, Juno discovered an octagon of eight cyclones at Jupiter’s northern pole and a similar five cyclone structure at its southern pole. Since then, both polygons have remained intact. What keeps the storm systems so stable is still an open question, but a recent observational study using Juno measurements found that an anticyclonic ring sits between the central and outer cyclones. In line with a previous theoretical study, this ring structure helps shield and stabilize the storm system.
The underlying convective mechanisms of the storm remain a mystery, though, as the current study is limited in resolution to a scale of about 200 kilometers. (Image credit: NASA/JPL-Caltech/SwRI/ASI/INAF/JIRAM; research credit: A. Ingersoll et al.; via Gizmodo)

Jupiter’s Frosted Clouds

This 3D rendering of Jupiter’s cloud tops is based on flyby data from the JunoCam instrument. It’s not a true physical image of the cloud tops, though scientists are working on a calibration for that. Instead, the elevations shown here are based on the intensity of visible light registered by the instrument. This measure correlates with cloud height, but there are exceptions. New 3D renderings of Jovian clouds show textured swirls akin to a cupcake’s sculpted frosting. The images are based on flyby data from the JunoCam instrument. Because illumination of the clouds is generally brightest for the highest clouds, the team has rendered elevation based on brightest. While this is somewhat physical, it’s not exactly what Jupiter looks like. For that, Juno scientists are working on a calibration that will translate these initial renderings into a truer physical model. Nevertheless, the results are stunning, especially the flyover video embedded over here! (Image credit: 3D renders – NASA / JPL-Caltech / SwRI / MSSS / G. Eichstädt, image pair – G. Eichstädt et al.; via phys.org; submitted by Kam-Yung Soh)

Cross your eyes to see this image pair as a 3D image of Jupiter’s cloud tops. The brighter regions will appear closer than the darker ones. 
Jovian Circulation
Jupiter‘s atmosphere remains quite mysterious, due to our limited ability to measure the depths of the gas giant’s clouds. But measurements from the Juno spacecraft are continuing to shape researchers’ understanding of our massive neighbor. By tracking ammonia distributions in Jupiter’s belts and zones, a team has found a series of circulation cells similar to the Ferrel cells of Earth’s midlatitudes.
Unlike the stronger Hadley cells and polar cells, Earth’s Ferrel cells are relatively weak. They’re driven by turbulence and the motion of the circulation cells to the north and south. The Northern and Southern hemispheres each have one Ferrel cell. In contrast, Jupiter — with its larger size and higher rotation rate — boasts eight Ferrel-like cells in each hemisphere! (Image and research credit: K. Duer et al.; via Universe Today; submitted by Kam-Yung Soh)

Jupiter in Infrared


This stunning new image of Jupiter in infrared is part of a data set combining measurements from ground- and space-based observatories. The glowing Jovian orb seen here is a composite of some of the sharpest images captured by the Gemini North Telescope’s Near-Infrared Imager from its perch on Mauna Kea. The brightest areas correspond to warmer temperatures over thinner, hazier clouds, whereas the dark areas mark towering, thick clouds.
The ground-based images — and observations from Hubble — were timed to coincide with passes from the Juno spacecraft. This combination of infrared, visible light, and radio wave observations gives scientists an unprecedented look at Jovian atmospheric processes. It revealed, for example, that lightning measured by Juno deep inside Jupiter’s atmosphere corresponded to convective storm cores visible to the other imagers. The combination of observations allowed the researchers to reconstruct the structure of these Jovian storms in a way that no single instrument could reveal. No doubt planetary scientists will learn lots more about Jovian convection from the data set. (Image credit: Jupiter – International Gemini Observatory/NOIRLab/NSF/AURA, M.H. Wong (UC Berkeley)/Gizmodo, illustration – NASA, ESA, M.H. Wong (UC Berkeley), and A. James and M.W. Carruthers (STScI); research credit: M. Wong et al.; via Gizmodo)

Jovian Vortices


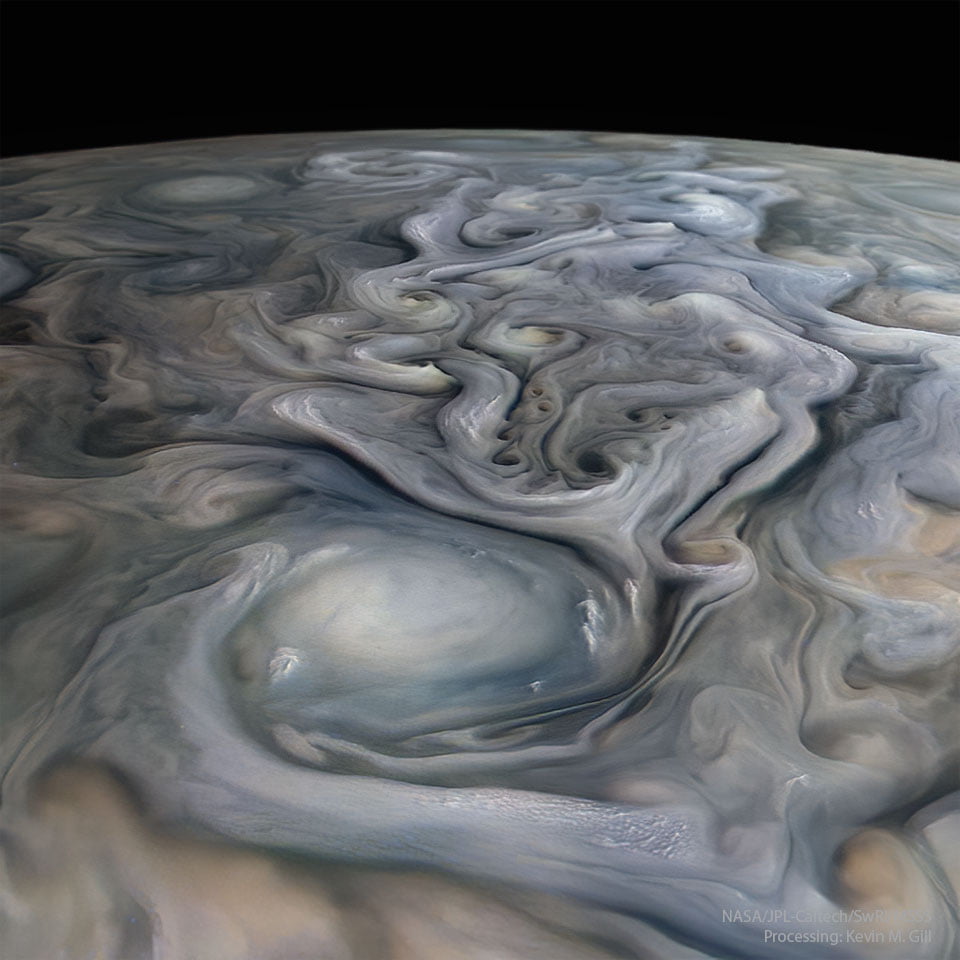
Jupiter continues to mesmerize in the images from JunoCam. With enhanced contrast, the planet’s eddies look like swirls you could just lean forward and fall into. The complexity of the Jovian atmosphere’s mixing is just astounding. It’s like an ever-changing Impressionist painting brought to life. Check out full-size versions of these stunning images here and here. (Image credit: NASA/JPL-Caltech/SwRI/MSSS/Kevin M. Gill, 1, 2; via Planetary Society; submitted by jpshoer)

Jupiter’s Swirls


Sometimes it amazes me that the Juno spacecraft was originally designed without any cameras onboard. The JunoCam instrument has produced stunning imagery of Jupiter thus far and shows no signs of stopping soon. The latest wonder is this false-color, high-contrast animation showing the motion of Jupiter’s clouds swirling and flowing past one another.
Now, this is not Jupiter as you would see it by eye. This animation is derived from two images taken 8 minutes and 41 seconds apart. In that time, Juno covered a lot of distance, so the two images had to be mathematically re-projected so that they appeared to be taken from the same location. Then, by comparing relative positions of recognizable features in the two photos and applying some understanding of fluid mechanics, observers could calculate the probable flow between those two states. Although this is a coarse example, it’s the same kind of technique often used in fluid dynamical experiments when measuring how flows change between two images. (Image credit: NASA/JPL/SwRI/MSSS/G. Eichstädt, source; via EuroPlanet; submitted by Kam-Yung Soh)

Jupiter’s Belts and Zones
Jupiter’s distinctive bands of colored clouds, known as belts and zones, have been an iconic part of the planet since they were first observed by Galileo. (The scientist, not the space mission!) They are considered part of Jupiter’s weather layer, the region of its atmosphere where storms reign. Thanks to gravitational measurements by the Juno spacecraft, we now know how deep these bands persist; they stretch about 3,000 kilometers into Jupiter! That means that Jupiter’s weather layer accounts for about one percent of the planet’s total mass. By comparison, Earth’s entire atmosphere makes up less than one millionth of its mass. What lies beneath Jupiter’s colorful clouds is also intriguing. The same gravitational measurements that indicate the weather layer’s depth also suggest that, beneath these storms, the rest of Jupiter rotates like a solid body. (Image credit: NASA, source; research credit: Y. Kaspi et al., submitted by Kam-Yung Soh)

Jovian Polar Vortices


Jupiter’s atmosphere is full of enduring mysteries, and its poles are no exception. Instruments aboard the Juno spacecraft have gotten a better look at Jupiter’s North and South poles than any previous mission, and what they’ve found raises even more questions. Both of Jupiter’s poles feature a central cyclone ringed by other, similarly-sized cyclones. The North pole has eight outer cyclones (top image), while the South pole has five (bottom image), shown above in infrared. Despite being close enough that their spiral arms intersect, the cyclones don’t seem to be merging into something like Saturn’s polar hexagon. For now, scientists don’t know how this arrangement formed or why it persists, but the longer Juno can study the vortices up close, the more we’ll learn. (Image credit: NASA/JPL-Caltech/SwRI/ASI/INAF/JIRAM; research credit: A. Adriani et al.; submitted by Kam-Yung Soh)

Juno’s Citizen Science


The Juno mission’s JunoCam has been producing stunning photos each time the spacecraft swoops past Jupiter. The instrument has a planning team, but its primary use is for citizen scientists, who have been suggesting images to take each orbit and have been processing those images. Most of the photos we see are like the one on the left above – photos that have been heavily color-enhanced to highlight details. The image on the right shows what Jupiter would look like to the human eye. Look closely, and you’ll catch many of the same colors and shapes in both photos.
At a recent conference, a member of JunoCam’s team presented scientific results that have come from the instrument, including analysis of Jupiter’s polar storm systems (8 vortices for the north pole and 5 for the south), tantalizing hints at Jovian equivalents to earthly cloud types, and more. She also announced a new Analysis page where members of the public can both see the science in progress and participate first-hand! (Image credit: NASA / SwRI / MSSS / G. Eichstädt / S. Doran; NASA / JPL-Caltech / SwRI / MSSS / B. Jónsson; via E. Lakdawalla; submitted by jshoer)