
The motions of Earth’s atmosphere are often invisible to the human eye, but fortunately, we’ve built tools to reveal them. This timelapse video shows the Earth in infrared light, first from a satellite view centered on the Pacific Ocean and second from a satellite centered on Central America. The water vapor in clouds is an excellent insulator, so clouds appear dark in this video. Warmer areas look brighter. The large-scale motion of the atmosphere and the wind bands that cut east and west across the world are apparent in the first half of the video, largely because they are not being interrupted by any land masses. In the second half of the video, the western coast of South America is intermittently visible. This is because the Andes Mountains disrupt air flow, pushing warm, moist air upward and causing it to condense into the dark-colored clouds that recirculate over the Amazon. Look further south along the coast and you’ll see the Atacama Desert flashing white each day as it heats up. (Video credit: J. Tyrwhitt-Drake/NASA; submitted by entropy-perturbation)
Tag: weather

Foggy Canyon
Timelapse photography reveals the tide-like motions of fog that filled the Grand Canyon last week. This unusual meteorological condition was created by a temperature inversion. Usually air near the ground is warmest and the atmosphere cools as the altitude increases. But occasionally a mass of warm air will trap a layer of cooler air beneath it. In the case of the Grand Canyon, cool foggy air was capped by a warmer air mass, resulting in a sea of fog. Depending on the conditions, temperature inversions can create other distinctive weather patterns like cloud streets or even supercell thunderstorms. (Video credit: Vox; via Flow Visualization)

Waterspouts
Waterspouts are commonly thought of as tornadoes over water, but this is only partially true. Some waterspouts do begin as tornadoes, but waterspouts are more commonly non-tornadic or fair-weather in origin. These non-tornadic waterspouts form when cold, dry air moves over warm water. As the warm, moist air rises, entrainment and conservation of angular momentum cause the air nearby to begin rotating. The spout does not actually suck water up from the surface. Instead, the humid rising air cools and the water vapor condenses, forming the cloud wall of the spout. Waterspouts are typically very short-lived and last 5 to 10 minutes before the inflowing air cools and the vortex weakens and dissipates. (Photo credit: U.S. Navy/K. Wasson)

The Atmospheric River
Atmospheric rivers are long, narrow corridors of concentrated water vapor transport in the atmosphere. They often occur when winds from storms over the ocean draw moisture together and project it ahead of a cold front. The phenomenon was only recognized in the 1990s, but subsequent research has shown that atmospheric river conditions account for many instances of heavy rainfall and flooding in areas along the West Coast of the United States. Forecasters can now recognize the phenomenon in forecast models, allowing them to predict potential flood-inducing rainfall days in advance. To learn more, check out NOAA’s atmospheric river Q&A. (Image credit: NOAA)
Supercell Thunderstorm
Photographer Mike Olbinski has captured a spectacular timelapse of a supercell thunderstorm over the plains of Texas. Supercells are characterized by a strong, rotating updraft known as a mesocyclone, seen clearly in the video. These storms are commonly isolated occurrences, forming when horizontal vorticity in the form of wind shear is redirected upwards by an updraft. Such a strong updraft is typically created by a capping inversion, a situation where a layer of warmer air traps the colder air beneath it. (This is why one sees a distinctive cut-off at the top of some clouds.) As warm air rises from the surface, either the air above the cap will cool or the air below the cap will warm. Either situation results in an instability with cooler air on top of warmer air, providing a catalyst for the kind of dramatic weather seen here. (Video credit: M. Olbinski; via io9)
Atmospheric Dynamics in the Lab
One way to explore some of the large-scale atmospheric dynamics we observe here on earth is through table-top demonstrations such as this one. Here a platform with a water tank is rotating at a constant velocity. The camera rotates with the tank; this is why the hand in the video seems to spin. At the center of the tank, ice in a can cools the water, while the warmer air along the periphery provides heating. The green dye marks initially cooler fluid while the red dye marks the warmer fluid from the outside of the tank. The dense cooler fluid sinks and moves outward while warmer water moves in to replace it. This creates radial circulation; the thermal gradients and rotation cause the eddies and jets seen from this top view, in much the same way that they form in the mid-latitudes of earth’s atmosphere. (Video credit: Marshall Lab, MIT)

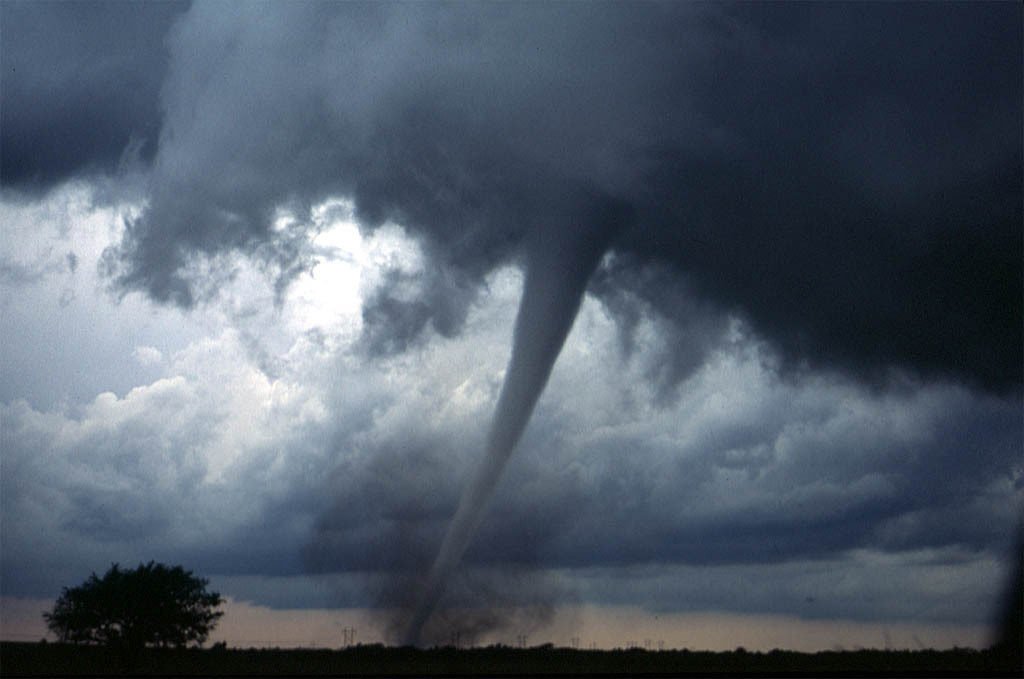
Tornadogenesis

Tornadogenesis–the formation of tornadoes–remains a topic of active research as there is relatively little direct experimental data, owing to the difficulty of prediction as well as measurement. Initially, a variation of wind speed at different altitudes in the atmosphere causes shearing, which can lead to the formation of a horizontal column of rotating air–a vortex line similar to a roll cloud. Beneath a developing storm, the updraft of warm local air can pull this vortex line upwards, creating vertical rotation in the cloud, thereby birthing a supercell. Supercells do not always spawn tornadoes, and the exact causes that result in tornadic or nontornadic supercells are not fully understood. However, the formation of tornadoes within the supercell seems dependent on the downdraft of cool air within the storm as well as stretching of the vortex line, which increases its rate of rotation. For more information, check out this explanatory video and some of the talks by Paul Markowski. (Thanks to mindscrib, aggieastronaut and others for their submissions related to this topic! Photo credits: P. Markowski and D. Zaras)

Winds Across the US

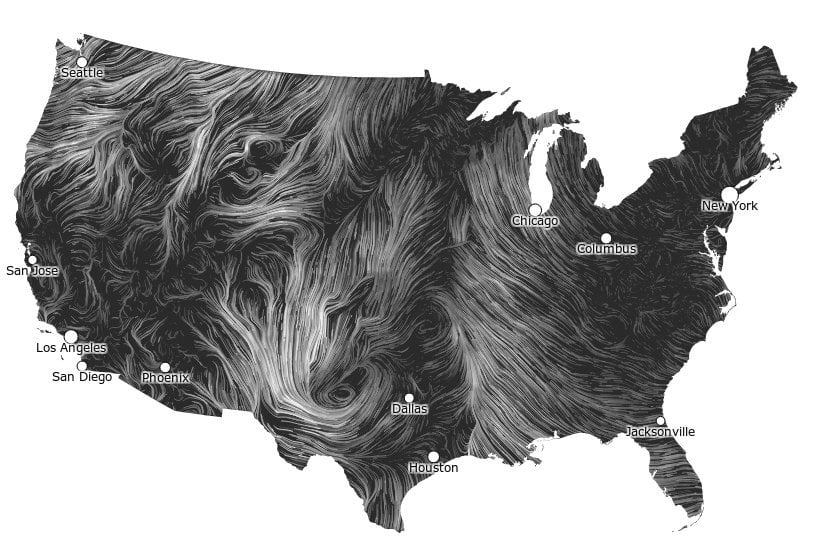
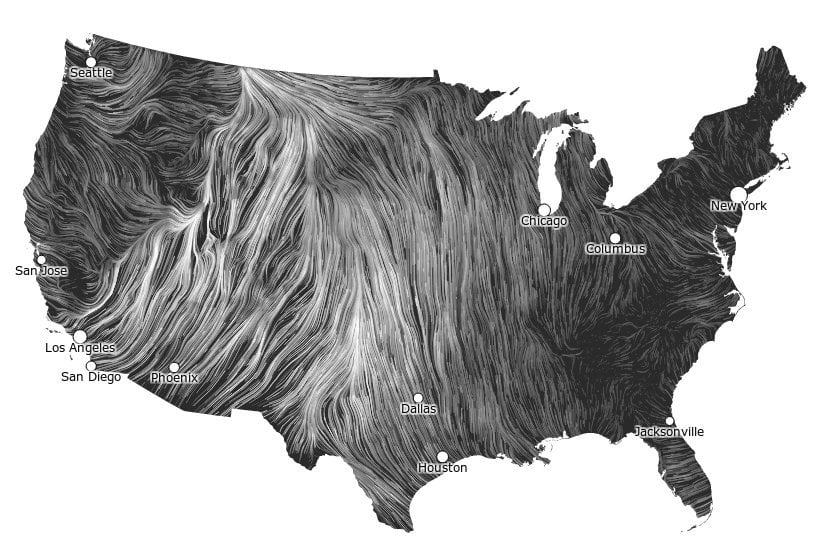
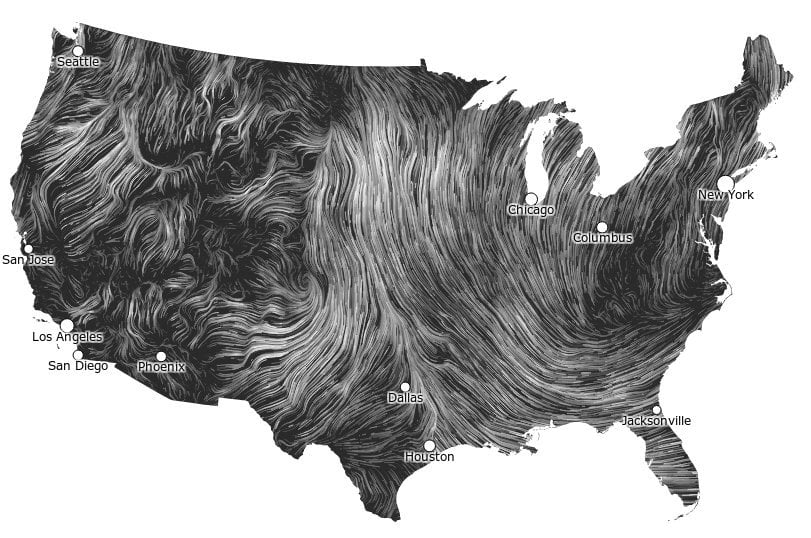
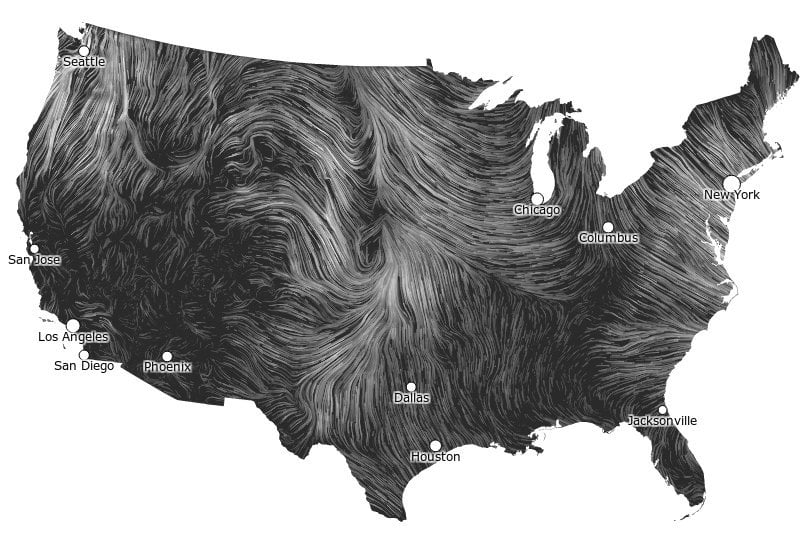
A collaborative project on data visualization brings to life the wind velocity data across the United States. The Wind Map is an interactive, nearly real-time indicator of wind conditions across the country, compiled on an hourly basis from the National Digital Forecast Database. Be sure to click through to see the data in motion. Observing the variety in wind patterns over the scale of days brings to light the swirling motion of surface winds much the way Perpetual Ocean does for surface currents. Fluid dynamics are all around us. (via Gizmodo)

Wave Clouds Over Alabama
Last week, Birmingham, Alabama got treated to a special cloudy day, thanks to some Kelvin-Helmholtz waves, shown above. When a layer of faster moving fluid shears a slower moving fluid, this instability can form and cause some spectacular mixing. In this case, the lower, slower fluid was cool and moist enough to contain clouds, enabling us to see the effect with the naked eye. The same mechanism is responsible for the shape of breaking ocean waves and can even be seen in the atmospheres of gas giants like Saturn and Jupiter. (submitted by David B)

High-Altitude Balloon Flight


Tangentially fluids-related, but SpaceWeather has a fun video of a high-altitude helium balloon bursting. Although this balloon carried a space-related payload, it’s the same type of set-up used for weather balloons. With only a few basic assumptions, it’s possible to do some neat calculations on the buoyancy, loading capacity, and behavior of such balloons.


