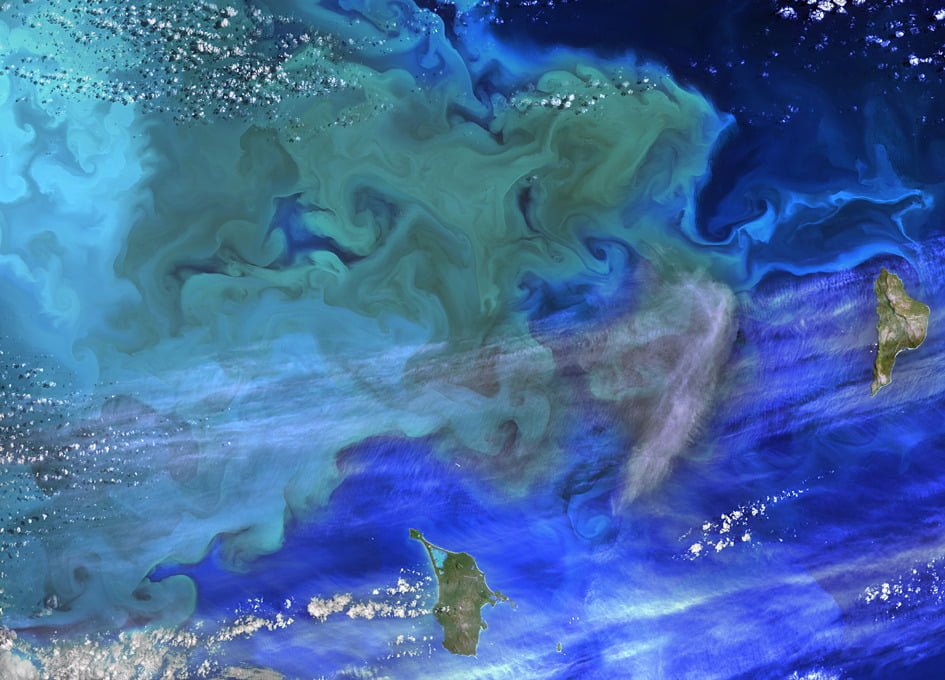
In satellite imagery the blue and green whorls of massive phytoplankton blooms stand out against the ocean backdrop. These microscopic organisms are part of a delicate predator-prey balance and can be very sensitive to nutrient concentrations and other environmental conditions. Their individual size is negligible, but in a bloom phytoplankton are numerous enough that they act as seed particles for the flow. As a result, differing concentrations of phytoplankton reveal the swirling, turbulent mixing of ocean waters. (Image credit: NASA/USGS; via SpaceRef; submitted by jshoer)
Tag: turbulent flow

Pyroclastic Flow

Saturday morning Japan’s Mount Ontake erupted unexpectedly, sending a pyroclastic flow streaming down the mountain. Many, though sadly not all, of the volcano’s hikers and visitors survived the eruption. Pyroclastic flows are fast-moving turbulent and often super-heated clouds filled with ash and poisonous gases. They can reach speeds of 700 kph and temperatures of 1000 degrees C. The usual gases released in a pyroclastic flow are denser than air, causing the cloud to remain near the ground. This is problematic for those trying to escape because the poisonous gases can fill the same low-lying areas in which survivors shelter. Heavy ashfall from the flow can destroy buildings or cause mudslides, and the fine volcanic glass particles in the ash are dangerous to inhale. The sheer power and scale of these geophysical flows is stunning to behold. Those who have witnessed it firsthand and survived are incredibly fortunate. For more on the science and history of Mount Ontake, see this detailed write-up at io9. (Image credits: A. Shimbun, source video; K. Terutoshi, source video; via io9)

City Winds Simulated
Anyone who has spent much time in an urban environment is familiar with the gusty turbulence that can be generated by steady winds interacting with tall buildings. To the atmospheric boundary layer–the first few hundred meters of atmosphere just above the ground–cities, forests, and other terrain changes act like sudden patches of roughness that disturb the flow and generate turbulence. The video above shows a numerical simulation of flow over an urban environment. The incoming flow off the ocean is relatively calm due to the smoothness of the water. But the roughness of an artificial island just off the coast acts like a trip, creating a new and more turbulent boundary layer within the atmospheric boundary layer. It’s this growing internal boundary layer whose turbulence we see visualized in greens and reds. (Video credit: H. Knoop et al.)

Transonic Flow
In the transonic speed regime the overall speed of an airplane is less than Mach 1 but some parts of the flow around the aircraft break the speed of sound. The photo above shows a schlieren photograph of flow over an airfoil at transonic speeds. The nearly vertical lines are shock waves on the upper and lower surfaces of the airfoil. Although the freestream speed in the tunnel is less than Mach 1 upstream of the airfoil, air accelerates over the curved surface of airfoil and locally exceeds the speed of sound. When that supersonic flow cannot be sustained, a shock wave occurs; flow to the right of the shock wave is once again subsonic. It’s also worth noting the bright white turbulent flow along the upper surface of the airfoil after the shock. This is the boundary layer, which can often separate from the wing in transonic flows, causing a marked increase in drag and decrease in lift. Most commercial airliners operate at transonic Mach numbers and their geometry is specifically designed to mitigate some of the challenges of this speed regime. (Image credit: NASA; via D. Baals and W. Corliss)

Supernova Explosion
Type 1a supernovae occur in binary star systems where a dense white dwarf star accretes matter from its companion star. As the dwarf star gains mass, it approaches the limit where electron degeneracy pressure can no longer oppose the gravitational force of its mass. Carbon fusion in the white dwarf ignites a flame front, creating isolated bubbles of burning fluid inside the star. As these bubbles burn, they rise due to buoyancy and are sheared and deformed by the neighboring matter. The animation above is a visualization of temperature from a simulation of one of these burning buoyant bubbles. After the initial ignition, instabilities form rapidly on the expanding flame front and it quickly becomes turbulent. (Image credit: A. Aspden and J. Bell; GIF credit: fruitsoftheweb, source video; via freshphotons)

Growing Turbulence

Flow patterns can change dramatically as fluid speed and Reynolds number increase. These visualizations show flow moving from left to right around a circular plunger. The lower Reynolds number flow is on the left, with a large, well-formed, singular vortex spinning off the plunger’s shoulder. The image on the right is from a higher Reynolds number and higher freestream speed. Now the instantaneous flow field is more complicated, with a string of small vortices extending from the plunger and a larger and messier area of recirculation behind the plunger. In general, increasing the Reynolds number of a flow makes it more turbulent, generating a larger range of length scales in the flow and increasing its complexity. (Image credit: S. O’Halloran)

Sneezes Vs. Coughs
Sneezing and coughing are major contributors to the spread of many pathogens. Both are multiphase flows, consisting of both liquid droplets and gaseous vapors that interact. The image on the left shows a sneeze cloud as a turbulent plume. The kink in the cloud shows that plume is buoyant, which helps it remain aloft. The right image shows trajectories for some of the larger droplets ejected in a sneeze. Like the sneeze cloud, these droplets persist for significant distances. The buoyancy of the cloud also helps keep aloft some of the smaller pathogen-bearing droplets. Researchers are building models for these multiphase flows and their interactions to better predict and counter the spread of such airborne pathogens. For similar examples of fluid dynamics in public health, see what coughing looks like, how hospital toilets may spread pathogens, and how adjusting viscoelastic properties may counter these effects. For more about this work, see the Bourouiba research group’s website. (Image credit: L. Bourouiba et al.)
When Turbulence Is Desirable
One of the common themes in aerodynamics, especially in sports applications, is that tripping the flow to turbulence can decrease drag compared to maintaining laminar flow. This seems counterintuitive, but only because part of the story is missing. When a fluid flows around a complex shape, there are actually three options: laminar, turbulent, or separated flow. An object’s shape creates pressure forces on the surrounding fluid flow, in some cases causing an increasing, or unfavorable, pressure gradient. When this occurs, fluid, especially the slower-moving fluid near a surface, can struggle to continue flowing in the streamwise flow direction. Consider the video above, in which the flow moves from left to right. Near the surface a turbulent boundary layer is visible, where fluid motion is significantly slower and more random. Occasionally the flow even reverses direction and billows up off the surface. This is separation. Unlike laminar boundary layers, turbulent boundary layers can better resist and recover from flow separation. This is ultimately what makes them preferable when dealing with the aerodynamics of complex objects. (Video credit: A. Hoque)
The Structure of Turbulence
Though they may appear random at first glance, turbulent flows do possess structure. The video above shows a numerical simulation of a mixing layer, a flow in which two adjacent regions of fluid move with different velocities. The upper third of the frame shows a top view, and the bottom frame shows a side view, in which the upper fluid layer moves faster than the lower one. The difference in velocities creates shear which quickly drives the mixing layer into turbulence. But watch the chaos carefully, and your eye will pick out vortices rolling clockwise in the largest scales of the mixing layer. These features are known as coherent structures, and they are key to current efforts to understand and model turbulent flows. (Video credit: A. McMullan)

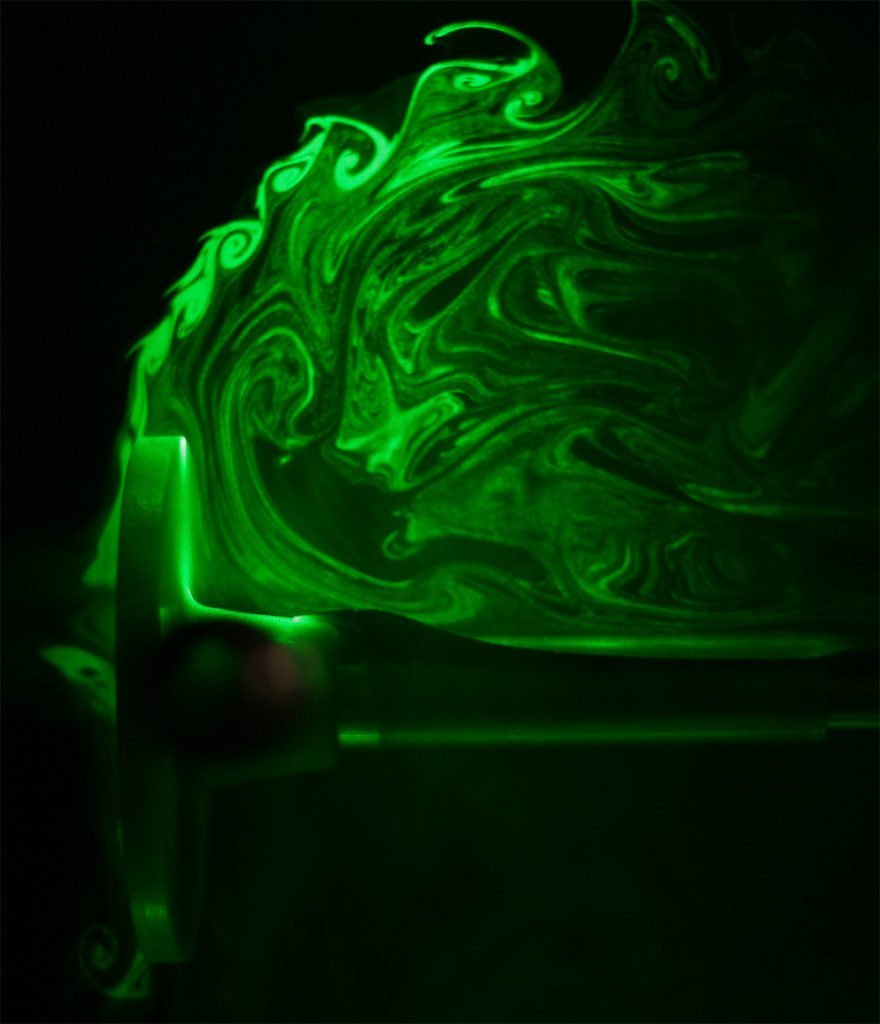
Oil Flow Viz
Fluorescent oil sprayed onto a model in the NASA Langley 14 by 22-Foot Subsonic Wind Tunnel glows under ultraviolet light. Airflow over the model pulls the initially even coat of oil into patterns dependent on the air’s path. The air accelerates around the curved leading edge of the model, curling up into a strong lifting vortex similar to that seen on a delta wing. At the joint where the wings separate from the body those lifting vortices appear to form strong recirculation zones, as evidenced by the spiral patterns in the oil. Dark patches, like those downstream of the engines could be caused by an uneven application of oil or by areas of turbulent flow, which has larger shear stress at the wall than laminar flow and thus applies more force to move the oil away. Be sure to check out NASA’s page for high-resolution versions of the photo. (Photo credit: NASA Langley/Preston Martin; via PopSci)