Billowing turbulence, mushroom-like Rayleigh-Taylor instabilities, and spreading flows abound in Vadim Sherbakov’s “Origin.” The short film takes a macro looks at fluids — inks, alcohols, soaps, and other household liquids. It was filmed entirely on a DJI Pocket 2, a rather small, stabilized pocket camera. It’s a testament to what you can achieve with some experimentation and relatively inexpensive equipment. (Video and image credit: V. Sherbakov)
We’re surrounded daily by convection — a buoyancy-driven flow — but most of the time it’s invisible to us. In this video, Steve Mould shows off what convection really looks like with some of his excellent tabletop demos. The first half of the video gives profile views of turbulent convection, with chaotic and unsteady patterns. When he switches to oil instead of water, the higher viscosity (and lower Reynolds number) offer a more structured, laminar look. And finally, he shows a little non-temperature-dependent convection with a mixture of Tia Maria and cream, which convects due to evaporation changing the density. (Image and video credit: S. Mould; submitted by Eric W.)
In fluid dynamics, we’re often concerned with flow moving past a solid surface — air past an airplane wing, water past fish scales, oil between moving parts — and those surfaces are rarely perfectly smooth. Rough surfaces affect the flow near them, sometimes in unexpected ways. Here, researchers show a rough surface’s effect on the eddies of the atmospheric boundary layer. Put differently, this poster shows how buildings, trees, and other features influence the lowest layer of the atmosphere. From the tiny gaps between buildings to the eddies towering many times higher, the turbulence reflects roughness’s effects. (Image credit: J. Kostelecky and C. Ansorge)
This rather mesmerizing video by Michiel de Boer uses a video editing technique to highlight movement and changes in video clips. From falling rain to rising mist to passing footsteps, the relatively simple technique visualizes all kinds of motion. De Boer calls it “motion extraction,” but it’s essentially a way to play with autocorrelation, a mathematical technique often used in fluid dynamics. It’s especially prevalent in turbulence, where it helps researchers identify parts of the flow that are closely related to one another. (Video and image credit: M. de Boer; via Colossal)
Vibrate a pool of water in air and the interface will form a distinctive pattern of waves called the Faraday instability. But what happens when you vibrate the interface between two fluids that can mix? That’s the question at the heart of this video. The researchers consider the situation both in simulation and experiment, showing how what begins as a smooth interface quickly becomes a thick turbulent mixture. Since the thickness of that mixing layer can be predicted theoretically, this set-up could be useful in industrial applications where mixing is needed. (Video, image, and research credit: G. Louis et al.)
In “Alive,” filmmaker Christopher Dormoy explores acrylic paints and the variety of ways in which the medium can be used. From a fluids perspective, there’s dripping, viscous flow, turbulent eddies, billowing plumes, and “accidental painting” due to density-driven instabilities. It’s a fun tour of fluid phenomena in art. What examples do you spot? (Video and image credit: C. Dormoy)
Signs of a ship’s passage can persist long after it’s gone. The churn of its propellers and the oil leaked from its engines leave a mark on the water’s surface that, in some cases, is visible even from orbit. But the frothy wake of a ship is no easy place to measure; there are simply too many bubbles. To reveal the physics behind that froth, these researchers turned to direct numerical simulation, a type of computational fluid dynamics that calculates the full details of a flow, typically using a supercomputer to do so.
In their poster, the blue field of wavy lines shows turbulence under the water’s surface. For (relative) simplicity, the turbulence is statistically uniform — as opposed to matching a particular ship’s wake. The interface between air and water is shown in red. The water surface is complex and undulating, spotted with bubbles trapped below the water and droplets flying through the air. Simulations like these help scientists focus on the detailed mechanisms that connect the turbulent water to the complex air-water surface. Once those are understood, researchers can develop models that approximate the physics for more specific situations, like the passage of a cargo ship. (Image credit: A. Calado and E. Balaras)
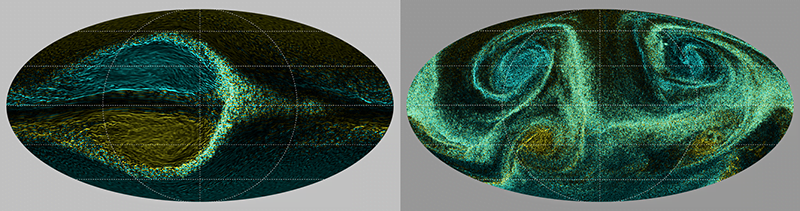
WASP-96B is a tidally-lockedexoplanet between the size of Saturn and Jupiter. This hot, massive planet lies close to its star, orbiting in less than three-and-a-half Earth days. A recent study shows that planets like these can have very different weather, depending on what depth their atmosphere absorbs heat at.
Using numerical simulations, researchers took a detailed look at the possible atmospheric dynamics on this planet. When the atmosphere absorbed heat at a shallow depth — near the outer layers of the planet — a coupled vortex pair formed (left, below). These vortices promenaded westward and completed a circuit around the planet every 11-15 days.
Shallow heating on a hot Jupiter produces a pair of coupled vortices (left), but deeper heating in the atmosphere generates four more-chaotic vortices (right).
In contrast, deeper heating produced a more-chaotic pattern of four vortices (right, above) that each lasted 3 to 15 days before disappearing, replaced by a new vortex. This atmosphere, they found, was very turbulent, with smaller-scale vortices as well.
Since each weather pattern is visually distinct and carries its own brightness signature, the authors predict that additional observations of WASP-96b with the current generation of telescopes will show which type of heating dominates on the exoplanet. (Image and research credit: J. Skinner et al.; via APS Physics)
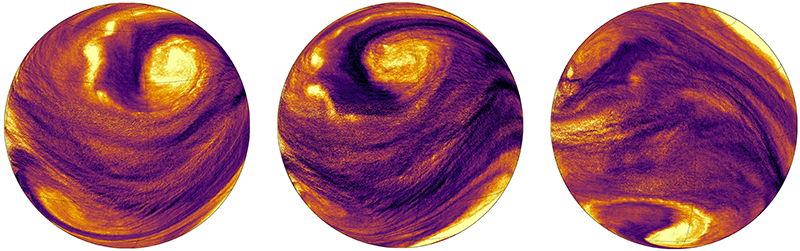
Snapshots from a simulation of a deep-heated hot Jupiter. Each image shows the planet on a different consecutive day.
In the winter, warm air rises from our floor vents or radiators, creating a complex, invisible flow in the background of our lives. Buoyancy lifts warmer air upward while cooler, denser air sinks back down. This thermal convection is everywhere: in our buildings, the ocean, the sky overhead — even in the visible layer of our sun.
In nature, these systems are so large and complex that fully measuring or simulating them remains impossible. Instead, researchers focus on a simplified system — a Rayleigh-Bénard cell — that’s essentially an idealized version of a pot on a stovetop. The lower surface of the cell is heated — like the bottom of a pan on the burner — while the upper surface of the fluid cools. Even this idealized system is a challenge, though, and neither lab-scale versions nor simulations can reach the same conditions that we find in nature.
To bridge the gap, scientists rely on mathematical models — theories built on our best understanding of the physics — and physical analogies to similar systems — like flow over a flat plate — that are “easier” to measure. For a thorough overview of recent work in the area, check out this review in Physics Today. (Image credit: A. Blass; research credit: D. Lohse and O. Shishkina in Physics Today)
Some 4,100 light years away in the Sagittarius constellation, a stellar nursery births new stars. Known as Messier 8, or the Lagoon Nebula, this region is one of the most visible nebulas from Earth. It is filled with turbulent gases and dark strands of dust. Near the centerline of the image is the bright, hourglass shape of the NGC 6530 star cluster. Its intense ultraviolet light ionizes surrounding gases, creating the distinctive red glow surrounding the nebula. (Image credit: J. Drudis and C. Sasse; via APOD)