The intense heat from wildfires fuels updrafts, lifting smoke and vapor into the atmosphere. As the plume rises, water vapor cools and condenses around particles (including ash particles) to form cloud droplets. Eventually, that creates the billowing clouds we see atop the smoke. These pyrocumulus clouds, like this one over California’s Line fire in early September 2024, can develop further into full thunderstorms, known in this case as pyrocumulonimbus. The storm from this cloud included rain, strong winds, lightning, and hail. Unfortunately, storms like these can generate thousands of lightning strikes, feeding into the wildfire rather than countering it. (Image credit: L. Dauphin; via NASA Earth Observatory)
Tag: turbulence

Billowing Ouzo


Pour the Greek liquor ouzo into water, and your glass will billow with a milky, white cloud, formed from tiny oil droplets. The drink’s unusual dynamics come from the interactions of three ingredients: water, oil, and ethanol. Ethanol is able to dissolve in both water and oil, but water and oil themselves do not mix.
In this video, researchers explore the turbulent effects of pouring ouzo into water. In particular, pouring from the top creates a fountain-like effect, due to a tug-of-war between the ouzo’s momentum and its buoyancy. Momentum wants the ouzo to push down into the water, and buoyancy tries to lift it back up. For an extra neat effect, they also show what happens when the ouzo is confined to a 2D plane and what happens when momentum and buoyancy act together instead of oppositely. (Image and video credit: Y. Lee et al.)
Fediverse Reactions
-
“Ink In The Water. Mix One.”


In this ASMR video, black ink diffuses in water. When the video starts, the ink is so diffuse that it’s not apparent the video is playing backward. It’s only as specific structures — things like Rayleigh-Taylor instabilities, plumes, and jets — coalesce from the background that we recognize the time reversal. Though it’s probably unintentional, this makes for a neat, subtle commentary on the nature of isotropic turbulence. (Video and image credit: Wryfield Lab)

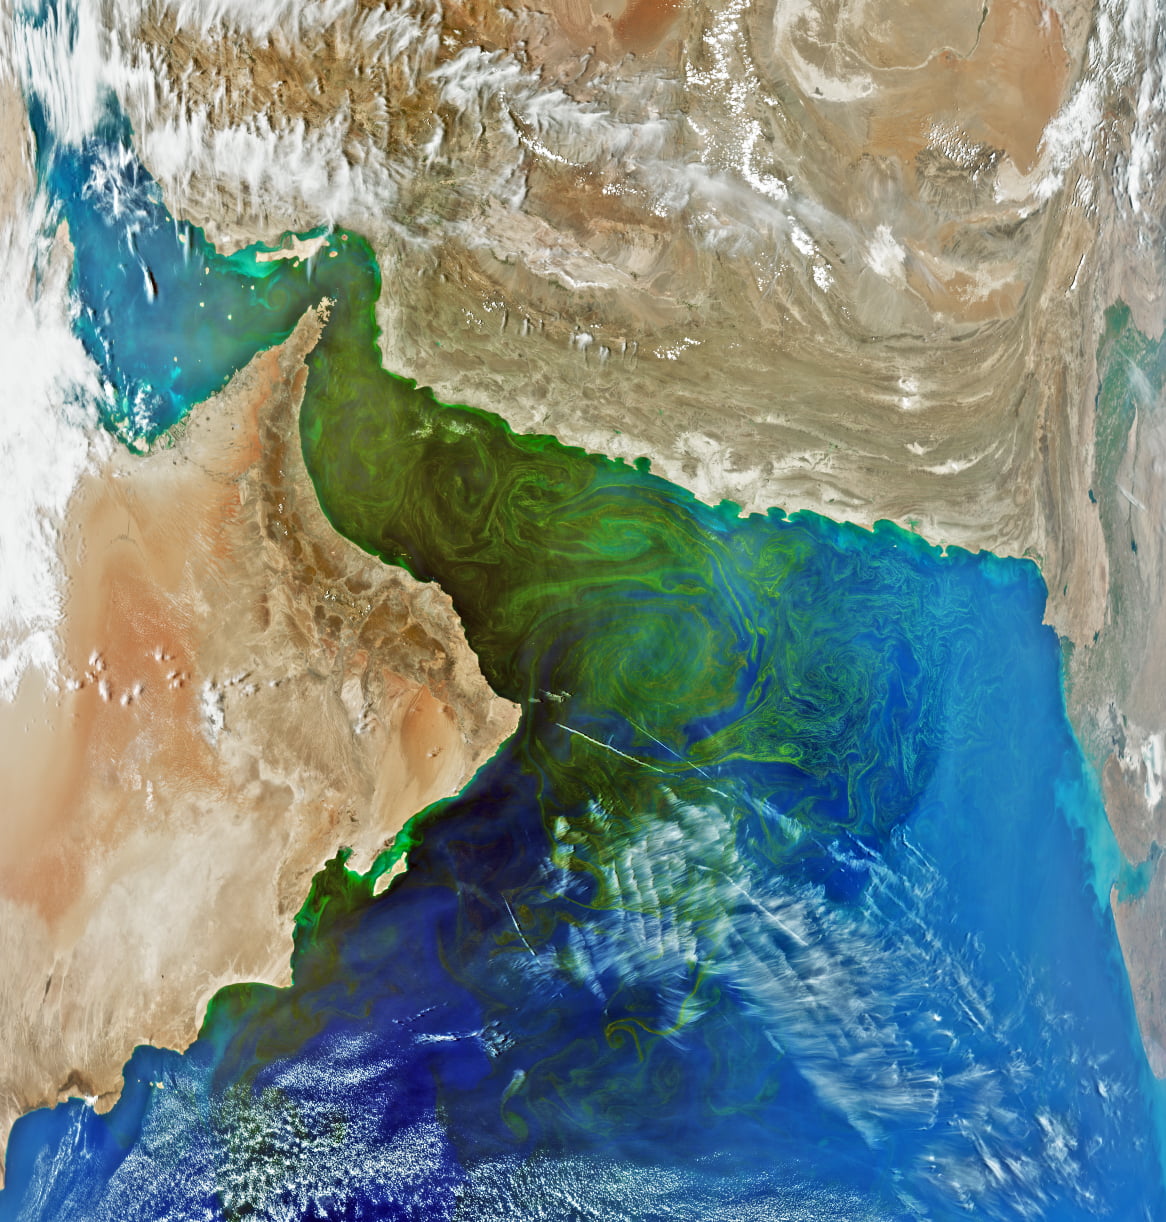
Swirls of Green and Teal
Captured in March 2024, this satellite image of the Gulf of Oman comes from an instrument aboard the PACE spacecraft. The picture of a phytoplankton bloom is not quite natural-color, at least not as our eyes would see it. Instead, engineers combined data taken from multiple wavelengths and adjusted it to bring out the fine details. It’s not what we’d see by eye, but every feature you see here is real.
Traditionally, the only way to identify the species of a phytoplankton bloom like this one is by taking a sample directly. But PACE’s instruments can detect hundreds of wavelengths of light, offering enough color detail that scientists may soon be able to identify and track phytoplankton species by satellite image alone. I wonder if distinguishing species could also provide some quantitative flow visualization from a series of these images. In the meantime, at least we can enjoy the view! (Image credit: J. Knuble; via NASA Earth Observatory)

Measuring Microfibers in Turbulence
Microplastic pollution is on the rise, especially in waterways. Microfibers — millimeters in length but only microns in diameter — are especially prevalent, as they get washed out of synthetic clothing. Collecting these pollutants first requires understanding how they move and cluster in turbulent flows. Researchers investigated that using a small water channel and high-resolution cameras.
The team followed microfiber strands as they moved through turbulence, paying special attention to how the fibers tumbled (rotating about their short axis) and spin (rotating around their long axis). How much fibers tumbled depended on the turbulence level; with more intense turbulence, the fibers tumbled more. Rates of spinning, they found, were consistently even higher than those for tumbling. By better understanding how microfibers behave in turbulence, we’ll be able to, for example, predict how far plastics will travel before settling to the ocean floor. (Image credit: Adobe Stock Photos; research credit: V. Giurgiu et al.; via APS Physics)

Measuring Ocean Upwelling
Large-scale ocean circulation is critical to our planet’s health and climate. In this process, seawater near the poles cools and sinks into the deep ocean, carrying dissolved carbon and nutrients with it. Later, that cold water gets pushed back up to the surface elsewhere, where it warms, and the cycle repeats. Although the theory behind this circulation has been around for decades, it’s been difficult to observe the rise, or upwelling, of water from the depths. But a recent study used a fluorescent, non-toxic dye to measure upwelling directly.
Researchers deployed 200 liters of dye just above the floor of a marine canyon near Ireland, then monitored the dye’s movement for several days at a depth of 2200. They found that turbulence along the slope of the canyon drove upwelling at speeds of about 100 meters per day, much faster than global rates. The authors suggest that this kind of topographically-enhanced upwelling could be a major factor in setting overall ocean circulation. (Image credit: visualization – NASA, ship – S. Nguyen; research credit: B. Wynne-Cattanach et al.; via Physics World)
“Aquakosmos – Ch. 2”


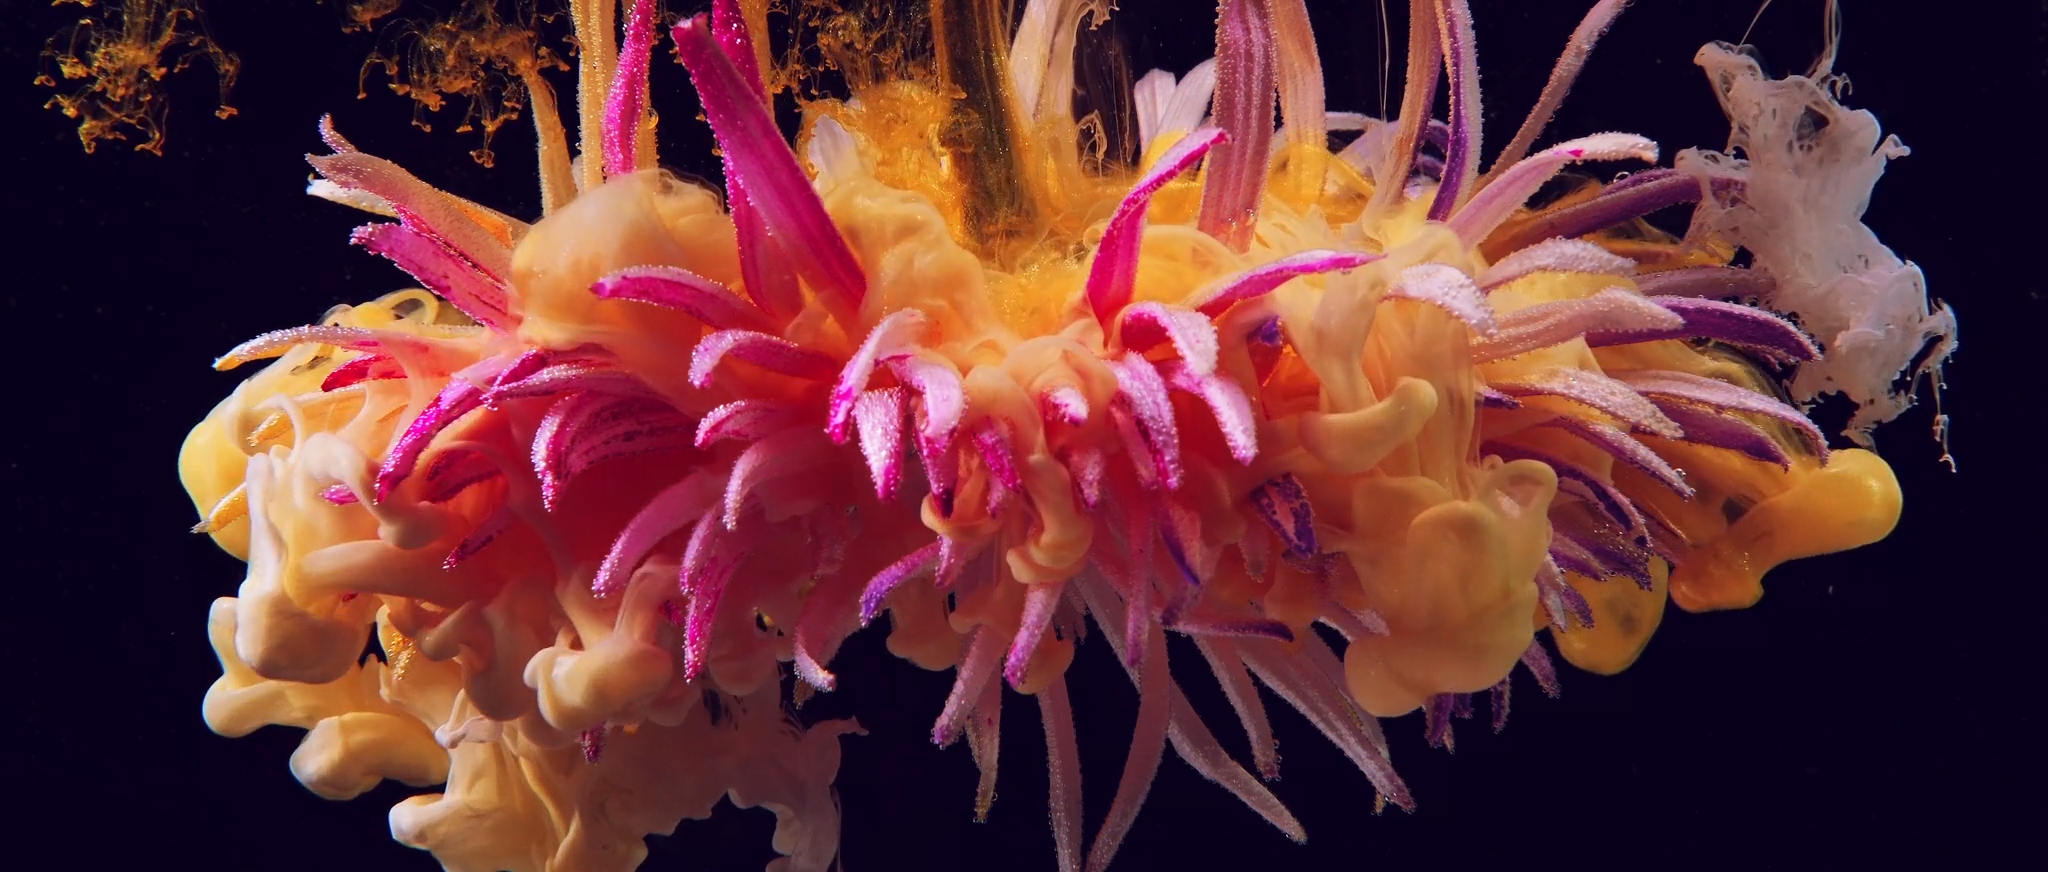
Colored inks bulge and billow around flowers in filmmaker Christopher Dormoy’s “Aquakosmos – Ch. 2”. Because ink is denser than the surrounding water, it sinks, forming mushroom-like shapes as the Rayleigh-Taylor instability takes over. One of the fun things about this particular video is that we see the Rayleigh-Taylor instability at many different sizes, depending on the size and speed of different falling dyes. (Video and image credit: C. Dormoy)

Sediment Swirls
Turbulent flows feature swirling eddies over a range of sizes — the larger the size range, the higher the Reynolds number. In this satellite image, sediment highlights these eddies in shades of turquoise, showing off the complexity of the flows created where rivers, ocean, and tides meet. The eddies we see here stretch from kilometers in width down to a handful of meters, but the flow’s turbulence persists down to millimeter-scales before viscosity damps it out. (Image credit: L. Dauphin; via NASA Earth Observatory)
Fediverse Reactions
-

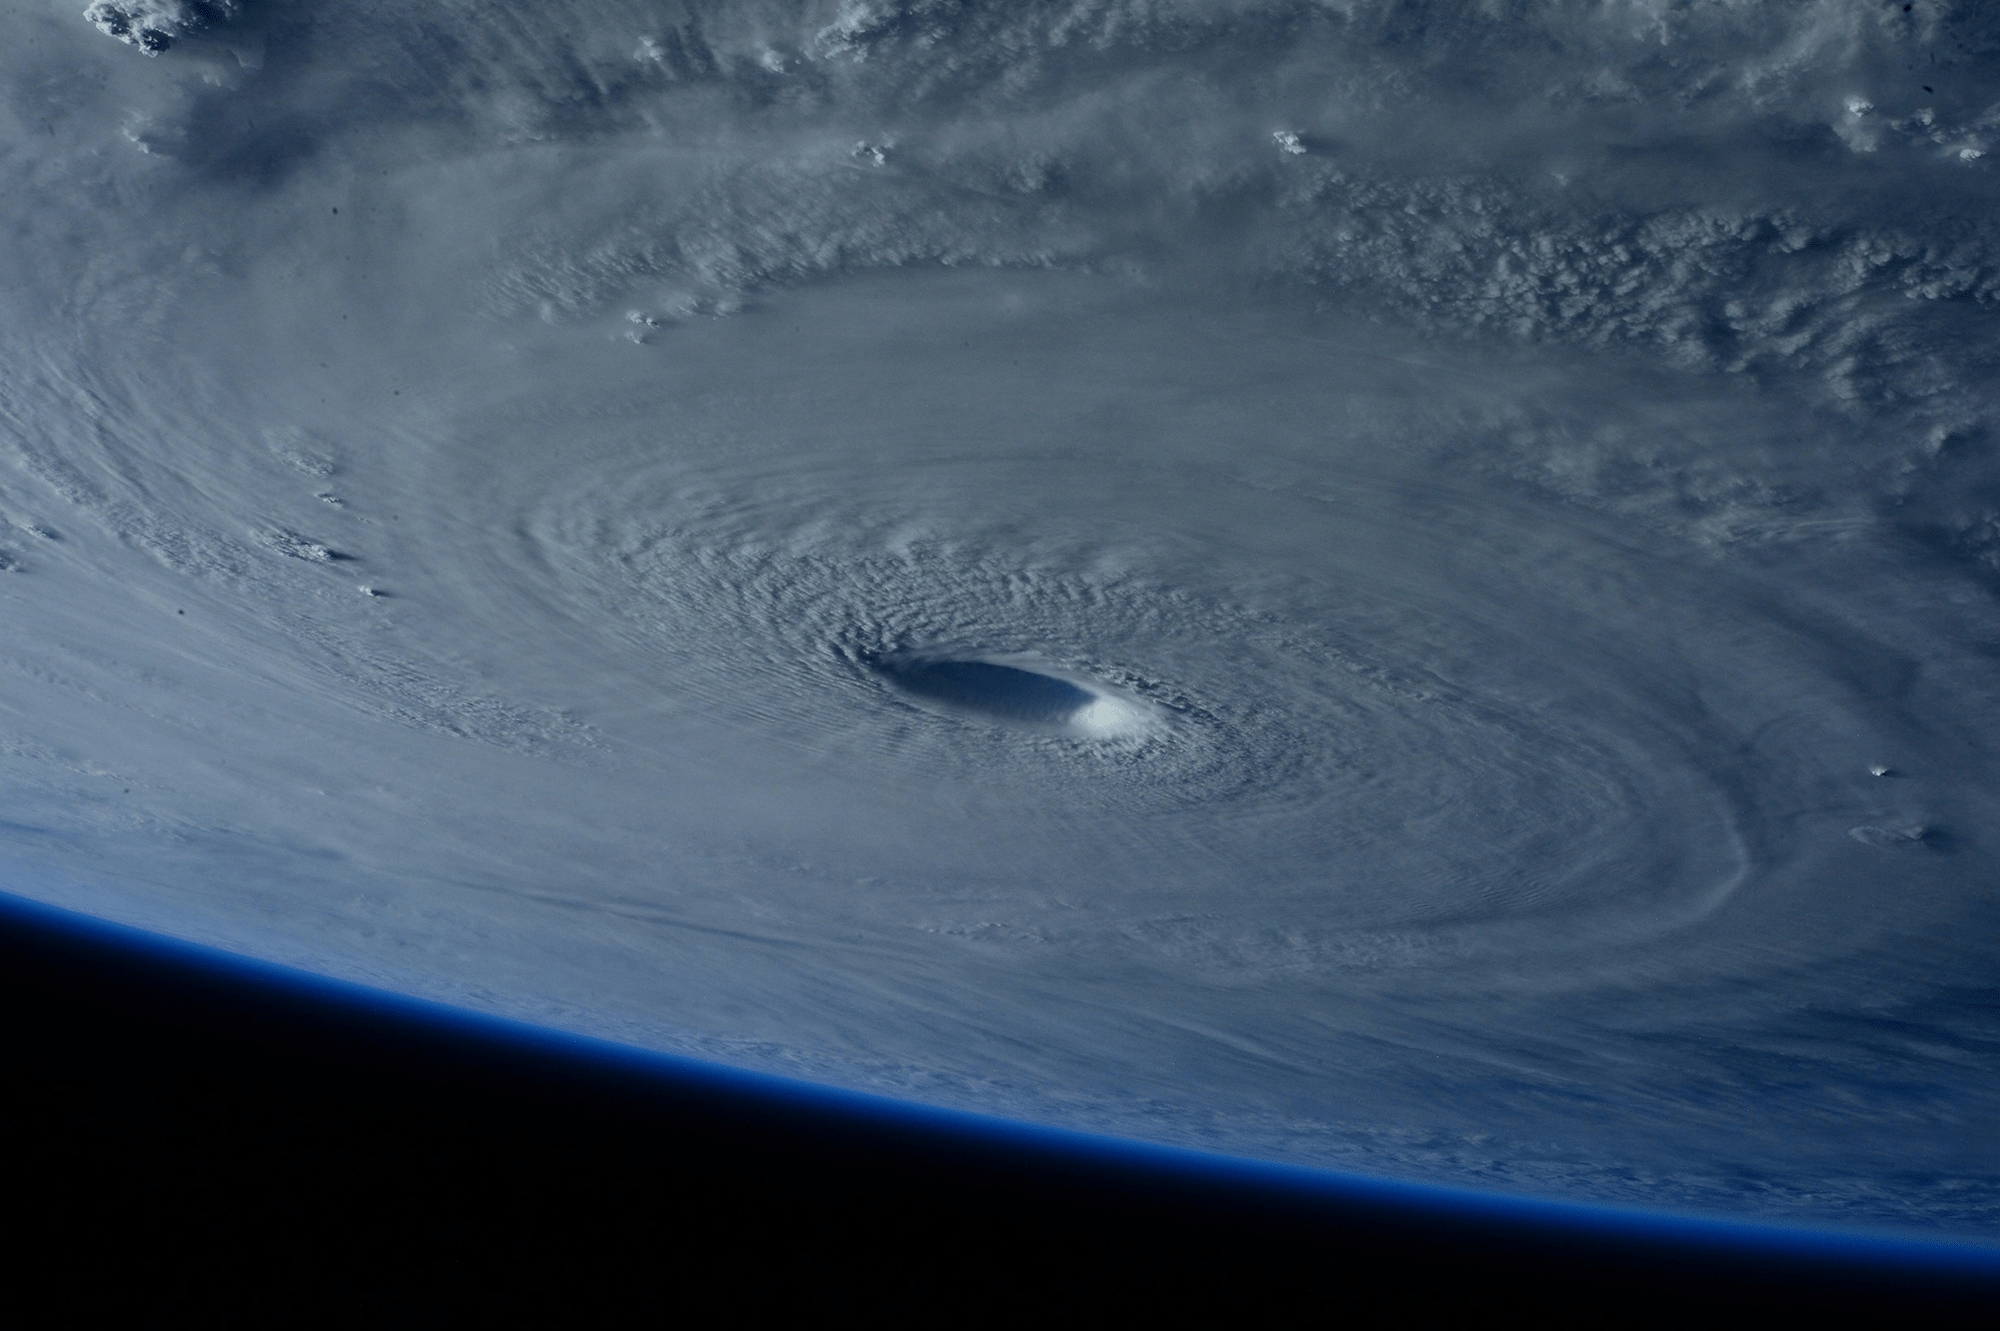
The Real Butterfly Effect
The butterfly effect — that the flapping of a butterfly’s wings in Brazil can cause a tornado in Texas — expresses the sensitivity of a chaotic system to initial conditions. In essence, because we can’t possibly track every butterfly in Brazil, we’ll never perfectly predict tornadoes in Texas, even if the equations behind our weather forecast are deterministic.
But this interpretation doesn’t fully capture the subtleties of the situation. With fluid dynamics, the small scales of a flow — like the turbulence in an individual cloud — are linked to the largest scales in the flow — for example, a hurricane. For short times, we’re actually quite good at predicting those large scales; our weather forecasts can distinguish sunny days and cloudy ones a week out. But at smaller scales, the forecast errors pile up quickly. No one can forecast that an individual cloud will form over your house three days from now. And because the small scales are linked to the larger scales, the uncertainties from the small scale cascade upward, limiting how far into the future we can reliably predict the weather.
And, unfortunately, drilling down to capture smaller and smaller scales in our models can’t fix the problem, unless our initial uncertainties are identically zero. To get around this problem, weather forecasters instead use ensemble forecasting, where they run many simulations of the weather with slightly different initial conditions. Those differences in initial conditions let the forecasters play with those initial uncertainties — how accurate is the temperature reading from that station? How reliable is the instrument reporting that humidity? How old is the satellite data coming in? Once all the forecasts are run, they can see how many predicted sunny days versus rainy ones, which ones resulted in severe weather, and so on. Often the probabilities we see in our weather app — like 30% chance of rain — depend on factors including how many of the forecasts resulted in rain.
Unfortunately, this butterfly effect permanently limits just how far into the future we can predict weather — at least until we fully understand the nature of the Navier-Stokes equations. For much more on this interesting aspect of chaos, check out this Physics Today article. (Image credit: NASA; see also T. Palmer at Physics Today)
Fediverse Reactions
-

A Shallow Origin for the Sun’s Magnetic Field
The Sun‘s complex magnetic field drives its 11-year solar activity cycle in ways we have yet to understand. During active periods, more sunspots appear, along with roiling flows within the Sun that scientists track through helioseismology. Longstanding theories posit that the Sun’s magnetic field has a deep origin, about 210,000 kilometers below the surface. But new measurements have prompted an alternate theory: that the Sun’s magnetic field originates in its outer 5-10% due to a magnetorotational instability.
Magnetorotational instabilities are usually associated with the accretion disks around black holes and other massive objects. When an electrically-conductive fluid — like the Sun’s plasma — is rotating, even a small deviation in its path can get magnified by a magnetic field. In accretion disks, these little disruptions grow until the disk becomes turbulent.
By applying this idea to the sun, researchers found they were better able to match measurements of the plasma flows beneath the Sun’s surface. With measurements from future heliophysics missions, they believe they can work out the mechanisms driving sunspot formation, which would help us better predict solar storms that can damage electronics here on Earth. (Image credit: NASA/SDO/AIA/LMSAL; research credit: G. Vasil et al.; via Physics World)