The intense heat from wildfires fuels updrafts, lifting smoke and vapor into the atmosphere. As the plume rises, water vapor cools and condenses around particles (including ash particles) to form cloud droplets. Eventually, that creates the billowing clouds we see atop the smoke. These pyrocumulus clouds, like this one over California’s Line fire in early September 2024, can develop further into full thunderstorms, known in this case as pyrocumulonimbus. The storm from this cloud included rain, strong winds, lightning, and hail. Unfortunately, storms like these can generate thousands of lightning strikes, feeding into the wildfire rather than countering it. (Image credit: L. Dauphin; via NASA Earth Observatory)
Tag: science

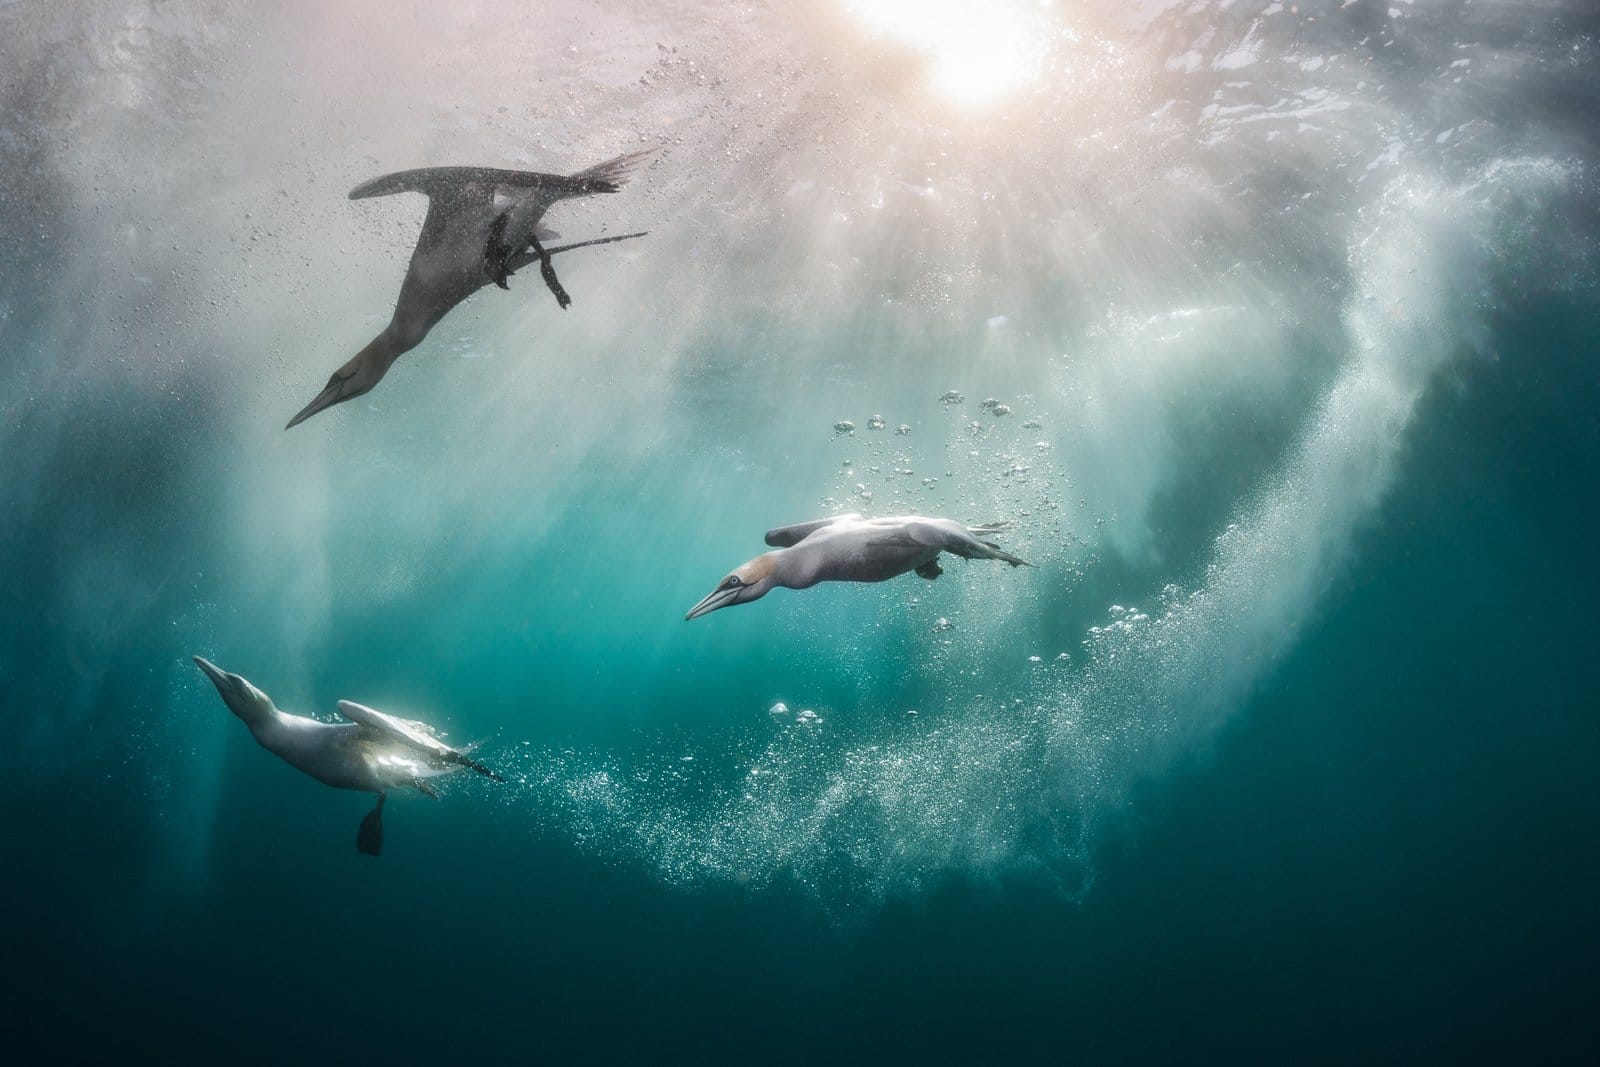
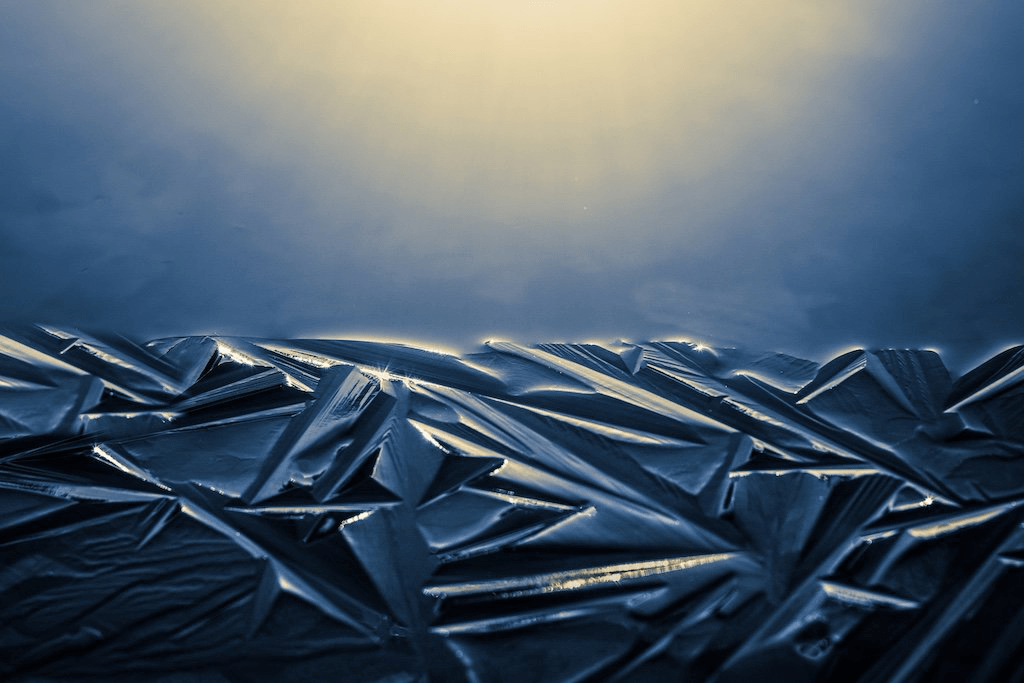
“Immersion”
Some seabirds, including gannets and boobies, feed by plunge diving. From high in the air, they fold their wings and dive like darts into the water, impacting at speeds around 24 m/s to help them reach the depths where their prey swim. With their narrow beaks and necks, the critical moments in this feat come when the bird’s head is submerged but its body remains out of the water. At this point, the bird’s head is decelerating quickly and its body is still moving at full speed; if the neck cannot withstand this combination of forces, it will buckle.
But plunge divers, it turns out, have a secret weapon that helps them handle impact: their head shape. A study of water entry dynamics using 3D-printed models of birds’ heads found that plunge divers have a shape that increases the amount of time it takes to enter the water. The impact forces stretch out over that longer period of contact, which also stretches out the time it takes for the bird to reach its maximum deceleration. The end result? That extended contact time protects birds from unsafe levels of deceleration, just like a crumple-zone in a crashing car keeps its occupants from experiencing the worst decelerations. (Image credit: K. Zhou/BPOTY; research credit: S. Sharker et al.; via Colossal)

Engineering Our Landfills


We create a lot of waste and, at least for now, much of that waste goes into landfills. Properly managing garbage requires much more than digging a hole in the ground, as Grady from Practical Engineering shows in this video. Maintaining a landfill requires careful management of water, soil, landfill strata, and even gas buildup. And these challenges don’t end once the trucks stop arriving. Landfills require decades of care even after their closure. Check out the video to learn more about how these artificial structures are built, managed, and maintained. (Video and image credit: Practical Engineering)

The Crashing Waves of French Polynesia


Surfer and photographer Tim McKenna lives in the village of Teahupo’o on Tahiti’s southeastern coast. The area’s shallow coral reef system creates some of the world’s biggest barreling waves, which attract surfers from around the world. McKenna captures the majestic power of these surges in these black-and-white photographs; you can find more of his work on his website and Instagram. (Image credit: T. McKenna; via Colossal)

Slushy Snow Affects Antarctic Ice Melt
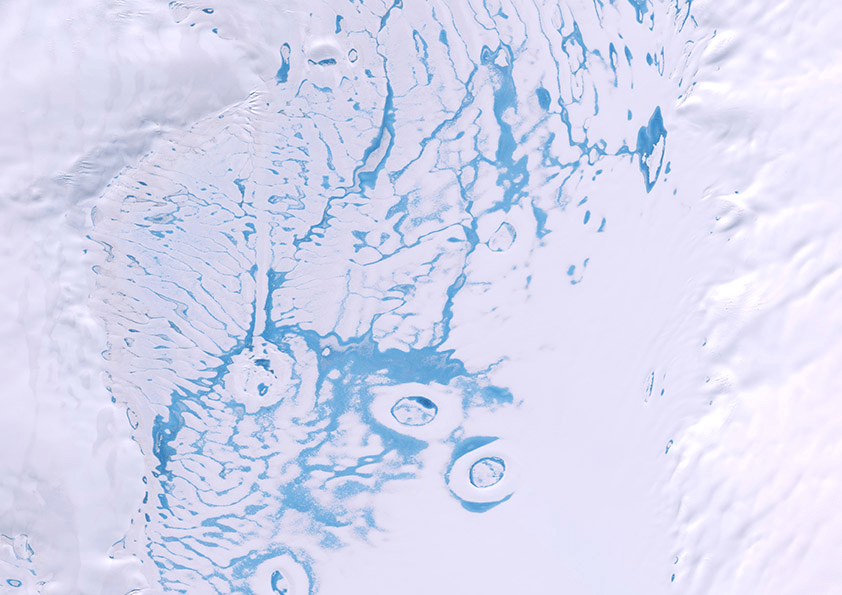
More than a tenth of Antarctica’s ice projects out over the sea; this ice shelf preserves glacial ice that would otherwise fall into the Southern Ocean and raise global sea levels. But austral summers eat away at the ice, leaving meltwater collected in ponds (visible above in bright blue) and in harder-to-spot slush. Researchers taught a machine-learning algorithm to identify slush and ponds in satellite images, then used the algorithm to analyze nine years’ worth of imagery.
The group found that slush makes up about 57% of the overall meltwater. It is also darker than pure snow, absorbing more sunlight and leading to more melting. Many climate models currently neglect slush, and the authors warn that, without it, models will underestimate how much the ice is melting and predict that the ice is more stable than it truly is. (Image credit: Copernicus Sentinel/R. Dell; research credit: R. Dell et al.; via Physics Today)
Swimming With Cilia
Like most microswimmers, these Synura uvella algae use cilia to swim. Cilia are tiny, hair-like appendages that flap to produce thrust. Even under a microscope, the cilia are hard to see because they are so thin and move quickly in and out of the microscope’s narrow focus. A cilia’s stroke is always asymmetric — no simple back-and-forth motions for them — because, at the algae’s scale, symmetric motion won’t move you anywhere. This is a peculiar feature of small swimmers in viscous fluids. At the human scale, we can mimic the same physics by mixing and unmixing fluids like corn syrup. (Video and image credit: L. Cesteros; via Nikon Small World in Motion)

Synura uvella algae swimming under magnification. 
Peering Inside Viscous Fingering
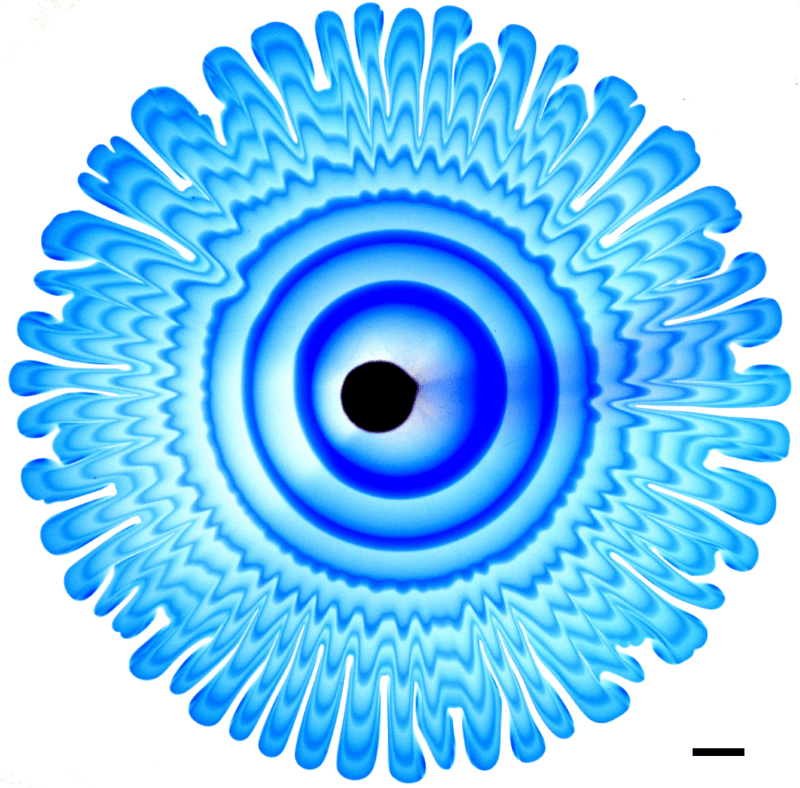
Viscous fingers form when a low-viscosity fluid is pumped into a narrow, viscous-fluid-filled gap. The branching pattern that forms depends on the ratio of the two viscosities, among other factors. To better understand what goes on inside these fingers, researchers carefully alternated injecting dyed and undyed fluid. This creates a pattern of concentric rings that deform as the fingers spread.
In this particular study, the initial fluid and injected fluids are miscible, meaning that they can mix into one another. In modeling their experiments, the team found that this mixing created stratification — i.e., layers of fluids with different densities — in the narrow gap between their plates. The stratification’s effects were large enough that the model required a correction term for them; that’s a bit surprising because we’d usually expect that the tiny third-dimension of the gap would be too small to matter! (Image and research credit: S. Gowan et al.)

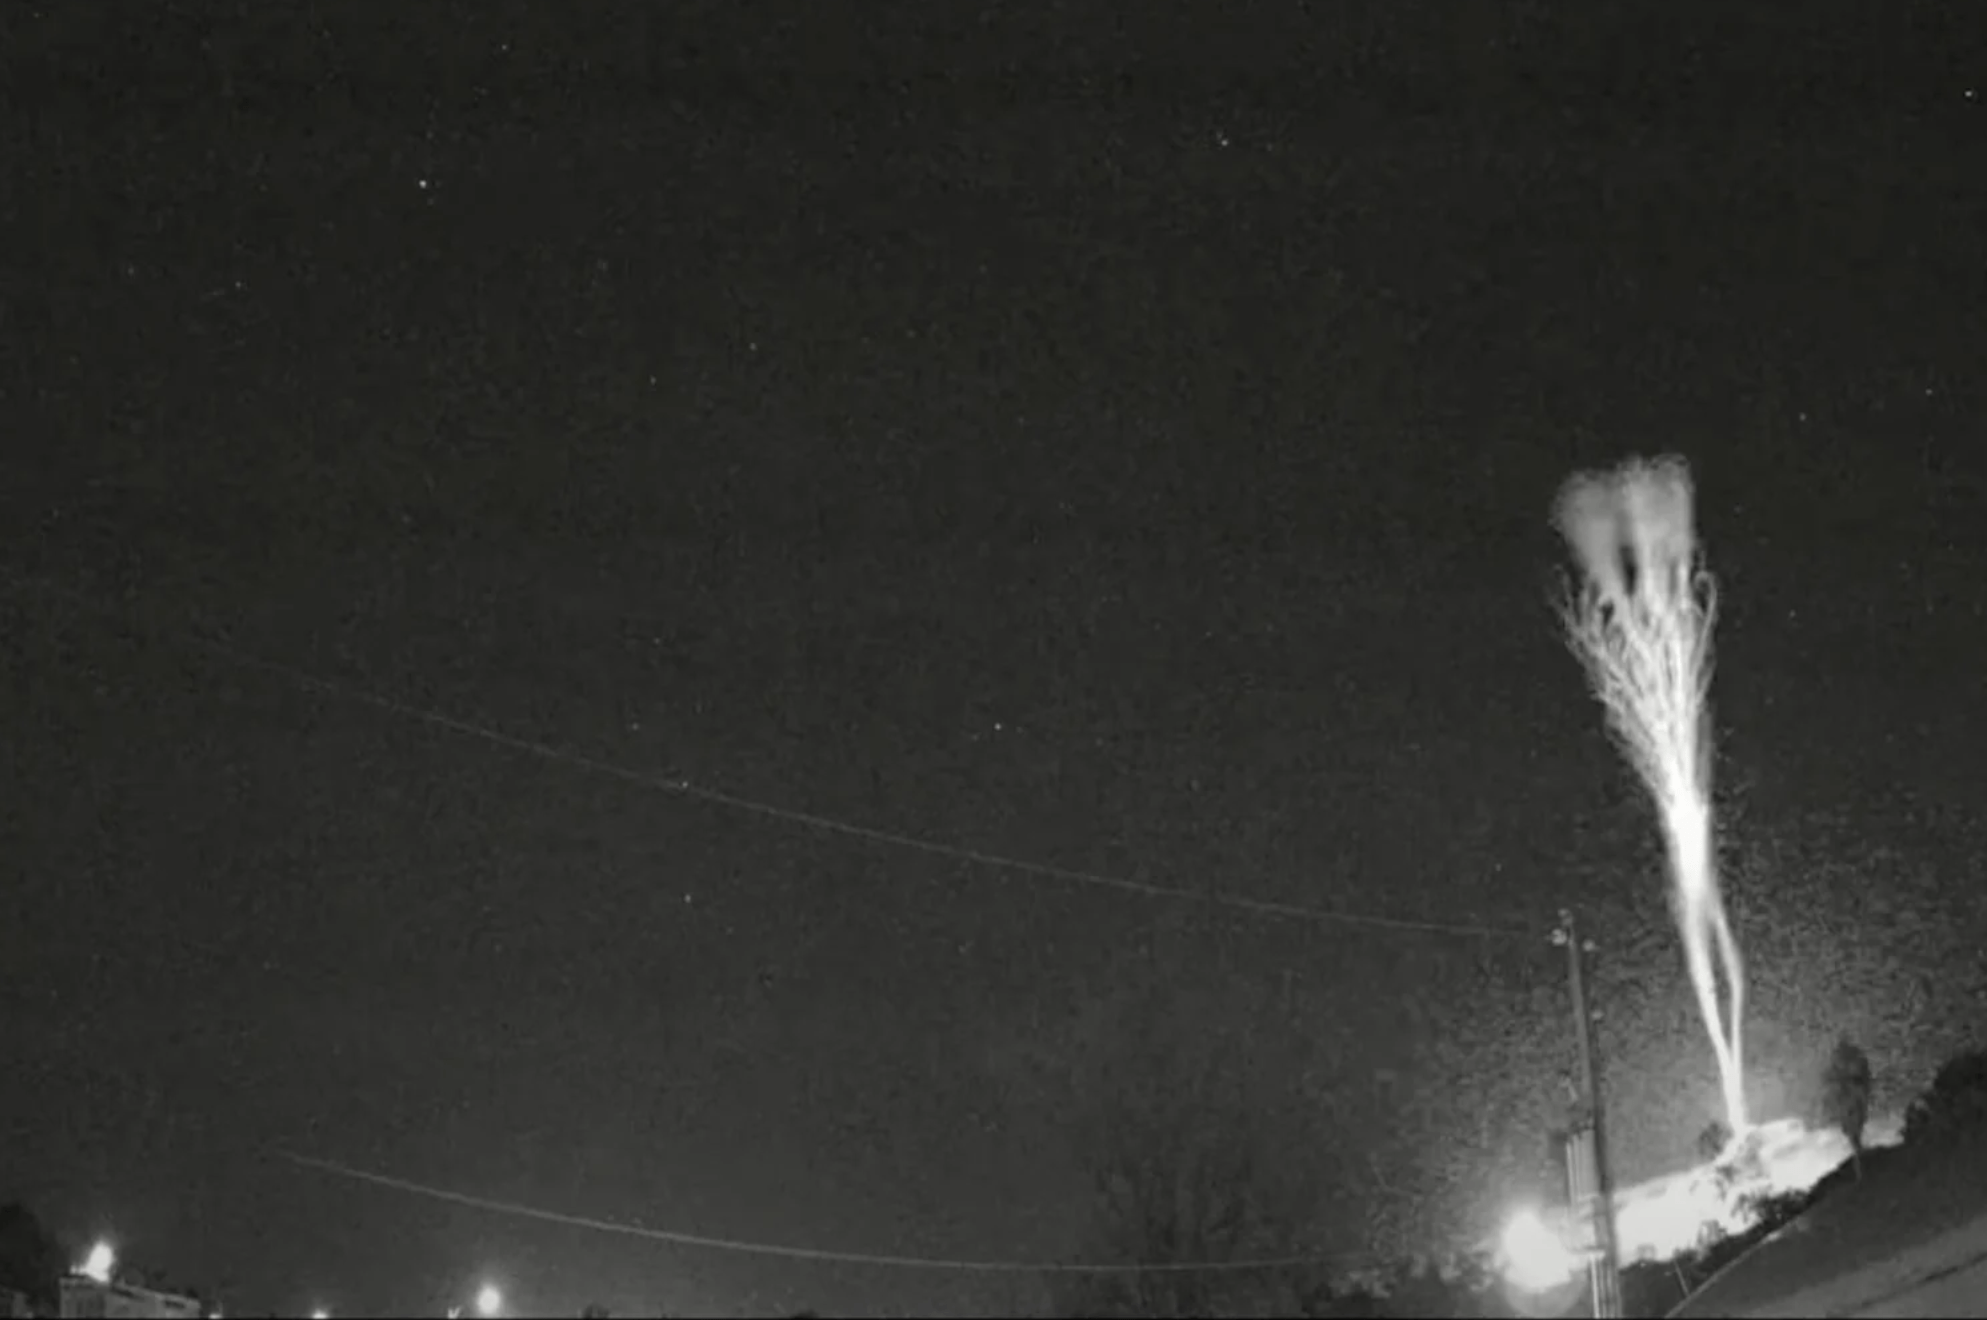
More Gigantic Jets
It’s wild that we’re still discovering new weather phenomena, but the gigantic jets seen here were only identified in 2002. This uncommon type of lightning shoots up from the tops of thunderstorms into the ionosphere. The video/image above was caught by cameras normally used to monitor meteors. The jets themselves are red in color, a result of the electrical discharge interacting with nitrogen in the atmosphere. (Video and image credits: b/w – Caribbean Astronomy Society, color – F. Lucena; via Gizmodo)
Tweaking Coalescence


When a drop settles gently against a pool of the same liquid, it will coalesce. The process is not always a complete one, though; sometimes a smaller droplet breaks away and remains behind (to eventually do its own settling and coalescence). When this happens, it’s known as partial coalescence.
Here, researchers investigate ways to tune partial coalescence, specifically to produce more than a single droplet. To do so, they add surfactants to the oil layer surrounding their water droplet. The surfactants make the rebounding column of water skinnier, which triggers the Rayleigh-Plateau instability that’s necessary to break the column into more than one droplet. (Image and video credit: T. Dong and P. Angeli)