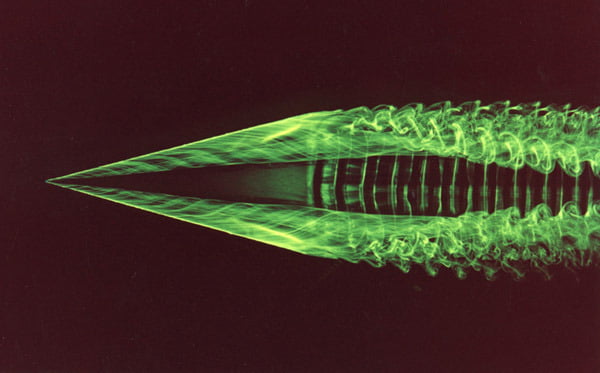
Fluorescent dye illuminated by laser light shows the formation and structure of vortices on a delta wing. A vortex rolls up along each leading edge, helping to generate lift on the triangular wing. As the vortices leave the wing, their structure becomes even more complicated, full of lacy wisps of vorticity that interact. Note how, by the right side of the photo, the vortices are beginning to draw closer together. This is an early part of the large-wavelength Crow instability. Much further downstream, the two vortices will reconnect and break down into a series of large rings. (Photo credit: G. Miller and C. Williamson)
Tag: science

Self-Assembling Ferrofluids
Ferrofluids–colloidal suspensions made up of ferromagnetic nanoparticles and a carrier liquid–are known for their interesting and sometimes bizarre behaviors due to magnetic fields. The video above shows how, when subjected to an increasing magnetic field, a single droplet of a ferrofluid on a superhydrophobic surface will split into several droplets. The process is called static self-assembly, and it results from the ferrofluid seeking a minimum energy state relative to the force supplied by the magnetic field. Change the magnetic field and the droplets shift to the next energy minimum. But what happens when you change the magnetic field continuously and too quickly for the droplets to respond? A whole different set of structures and behaviors are observed (video link). This is dynamic self-assembly, a different ordered state only achieved when the ferrofluid is forceably kept away from the energy minima seen in the first video. For more, see the additional videos and the original paper. (Video credit: J. Timonen et al.; via io9)
“Perpetual Puddle Vortex Experiment”
Anthony Hall’s “Perpetual Puddle Vortex Experiment” is an intriguing display of several physical mechanisms. What looks like a puddle is actually a vortex constantly sucking fluid down a hole in the table. The liquid is re-circulated into the puddle so it never disappears. The table itself is treated to be hydrophobic, causing the distinctive curvature and large contact angle of the puddle’s rim. The oils mixed in float on top, creating patterns of foam that visualize the swirling motions of the fluid as the vortex pulls it in. (Video credit and submission by: A. Hall)
Instability: Dense Over Light
Here on Earth, placing a dense layer of fluid atop a less dense layer is unstable. Specifically, the situation causes the interface between the two fluids to break down in what is known as the Rayleigh-Taylor instability.The video above shows a 2D numerical simulation of this breakdown, with the darker, denser fluid on top. The waviness of the initial interface provides a perturbation–a small disturbance–which grows in time. The two fluids spiral into one another in a fractal-like mushroom pattern. The continued motion of the dense fluid downward and the lighter fluid upward mixes the entire volume toward a uniform equilibrium. For those interested in the numerical methods used, check out the original video page. (Video credit: Thunabrain)

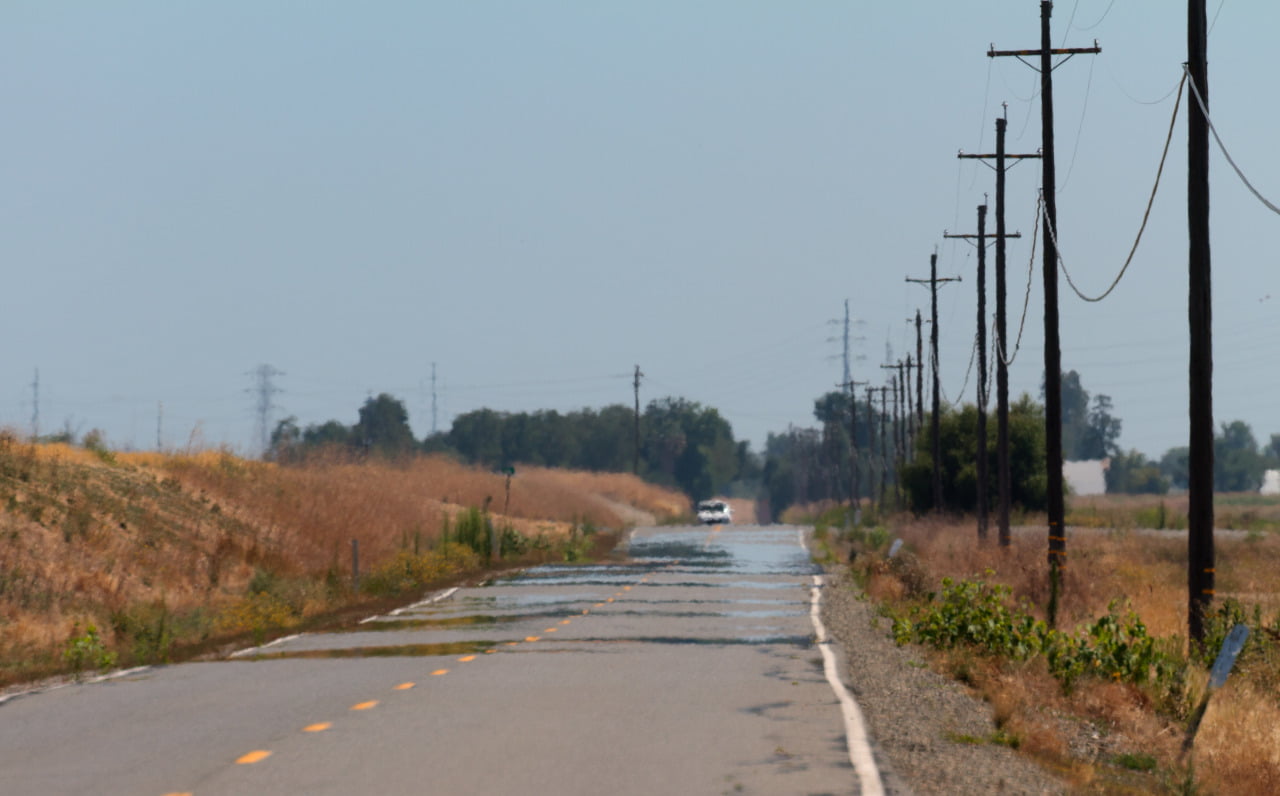
Reader Question: Heat Shimmer
Reader dialectical-induction asks:
Being as its pretty hot right now where I am, I was always curious, what exactly is occurring when the air is seemingly rippling on a hot day. I’ve noticed this phenomenon most often close to the pavement or anywhere where it’s really hot. Is it moisture in the air, off the pavement. What’s going on?!
Good question! This is a pretty common optical illusion to observe, especially when driving on a hot day, and it goes by many names including mirage and heat shimmer. What’s happening is actually a case of refraction, much like when a straw in a glass of water looks bent. Near the ground, the air is significantly hotter (maybe 10 degrees Celsius) than the air about a meter above the surface. Changing air’s temperature also changes its index of refraction. When a ray of light passes from the layer of cooler air into the hotter air near the ground, it encounters a lower index of refraction and will bend upward toward the higher index of refraction. From an observer’s perspective, these distorted rays look like they are coming straight from the ground, making it look as if a refracted image of the sky is the ground. The brain will often interpret this as a spurious puddle reflecting the sky. Getting closer to the mirage makes it disappear because the light bends less (relatively speaking) as the angle between the observer and mirage source increases. The rippling effect you note is typically a result of this refraction occurring through hot, moving air. (Photo credit: M. Fern)
Brownian Motion
Have you ever noticed how motes of dust seem to dance around even in still air? The reason they do is because all the atoms and molecules in the air have a certain amount of random motion and all those tiny random motions result in collisions on the dust particles that shift them around. The technical term for this is Brownian motion, named for botanist Robert Brown who noticed through his microscope that particles of pollen floating on water moved constantly under no apparent force. The video above demonstrates the effect in 2D with vibrating brass particles representing atoms and a polystyrene ball as the pollen. Alternatively, you can see Brownian motion in the movement of nanoparticles in water. Although most areas of fluid dynamics do not explicitly consider the random motions of all these particles, the concept is fundamental to the nature of pressure and temperature, both of which are important quantities in fluid dynamics. (Video credit: Sixty Symbols; topic requested by just-a-random-nerd)

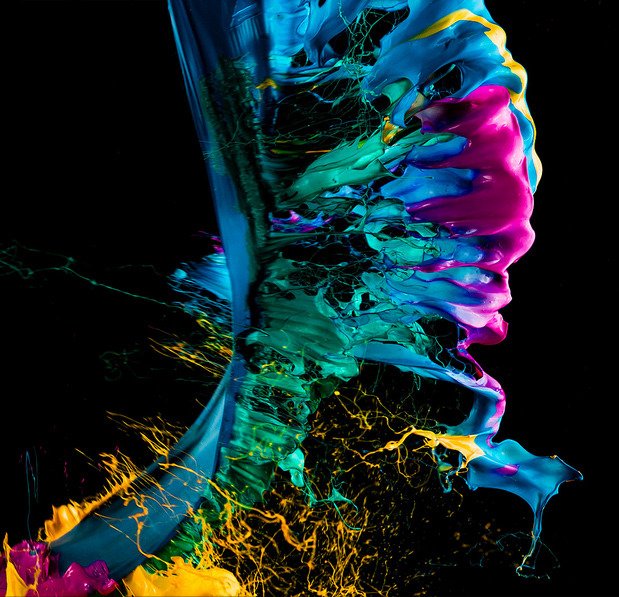
“Liquid Jewel”
Just a reminder that today is your last chance to participate in our reader survey. If you haven’t had a chance yet to fill it out, please do. The data are very important to us, not just for this site, but for improving science outreach online in general. Thank to those who have filled out the survey and especially those who left suggestions. You guys have some great ideas!
Today’s image is from artist Fabian Oefner’s “Liquid Jewel” series, featuring paint-filled balloons moments after rupture. Oefner has several series displaying physical forces as visual media, including the previously featured “Black Hole” and “Millefiori” photos. (Photo credit: F. Oefner)

Fluids Round-up – 27 July 2013
Fluids round-up time! Here are our latest fluidsy links from around the web:
- Science@NASA explains how to use capillary action to drink one’s coffee in microgravity. (via io9)
- Nature is not exactly a quiet place. Here are a couple of things you probably haven’t heard: icebergs breaking up and running aground and the “seismic scream” preceding a volcanic eruption.
- Mars Curiosity’s work indicates that Mars once had a thick atmosphere but lost it about 4 billion years ago, possibly to the solar wind after losing its magnetic field.
- Check out this great looped surfing footage for a different perspective on waves (submitted by joteefox)
- io9 offers a primer on the Mach number. It’s worth noting that, for a(n ideal) gas, the speed of sound depends only absolute temperature and composition.
- Disney has designed a device called Aireal that uses vortex rings to provide haptic feedback. (submitted by vincent)
- Ever come across mammatus clouds before? Their distinctive shape is a result of forming from sinking air rather than rising air like most other clouds. (via io9)
(Photo credit: T. Thai)
Reminder: This weekend is your final chance to take the reader survey! Thank you to everyone who has taken a couple minutes to share their thoughts.
The Fluid Dynamical Sewing Machine
Originally posted: 3 Jan 2012 Nonlinearity and chaos are important topics for many aspects of fluid dynamics but can be difficult to wrap one’s head around. But this video provides an awesome, direct example of one of the key concepts of nonlinear systems–namely, bifurcation. What you see is a thread of very viscous fluid, like honey, falling on a moving belt. Initially, the belt is moving quickly and the thread falls in a straight line. When the belt slows down, the thread begins to meander sinusoidally. With additional changes in the belt’s speed, the thread begins to coil. A multitude of other patterns are possible, too, just by varying the height of the thread and the speed of the belt. Each of these shifts in behavior is a bifurcation. Understanding how and why systems display these behaviors helps unravel the mysteries of chaos. (Video credit: S. Morris et al.)
Reminder: There’s still time left to take the reader survey! Please take a couple minutes to help improve FYFD and science outreach. Thank you!

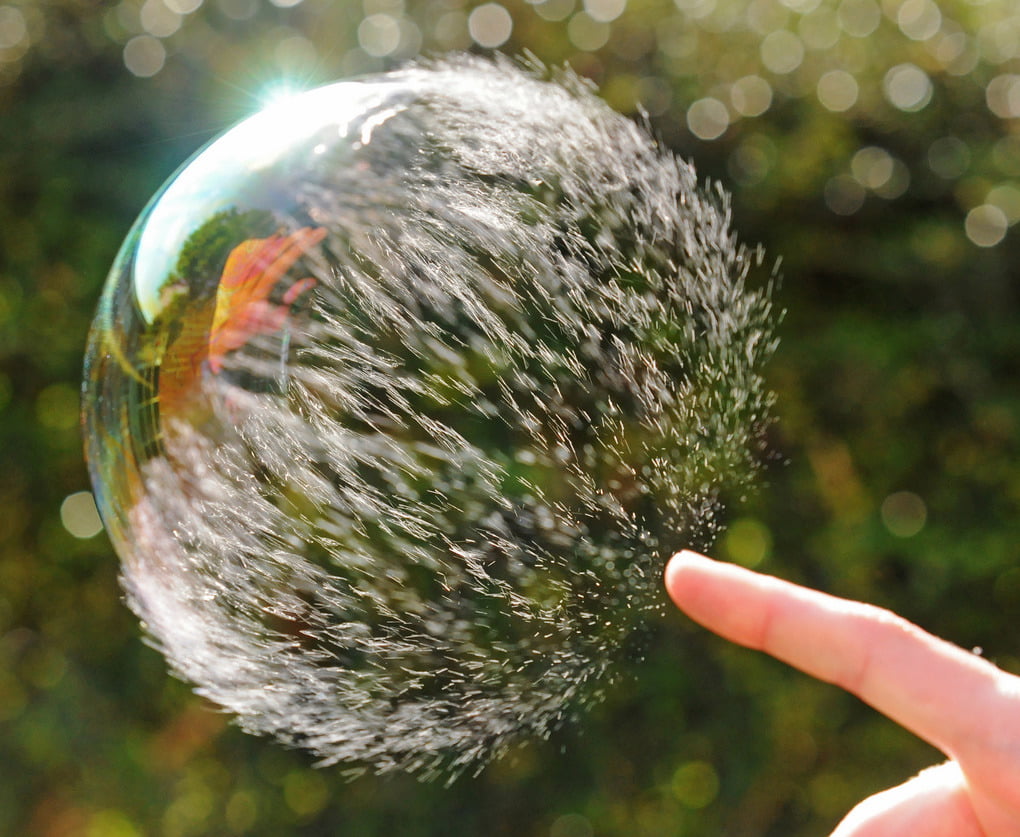
Bursting Bubble
Originally posted: 24 Aug 2011 That soap bubbles burst in the blink of an eye is a pity considering how fascinating their disappearing act is. This photo set from photographer Richard Heeks captures the bubbles mid-burst. Once the bubble’s film is breached, surface tension rips the smooth film back like a broken balloon, causing the liquid that used to be part of the bubble to erupt into droplets. (Photo credit: Richard Heeks)
Reminder: Many thanks to those who have filled out the survey! There are some great responses so far. If you haven’t done so, won’t you please fill out our reader survey?