
BYU Splash Lab–those breakers of bottles, skippers of rocks, spinners of eggs, students of soap films, masters of splashes, and all-around cool fluid dynamicists–have some fluids-themed, high-speed holiday greetings. Likewike, here at FYFD we’ll be spending the next week celebrating the physics and fluid dynamics of the winter holiday season! In the meantime, you can whet your appetite by brushing up on your cookie dunking techniques, watching how icicles form, and enjoying a good beverage. Stay tuned and happy holidays from FYFD! (Video credit: BYU Splash Lab/BYU News)
Tag: science

Shuttle Re-Entry
Complicated shock wave patterns envelope vehicles traveling at supersonic and hypersonic speeds. A shock wave is essentially a very tiny region–only a few mean free path lengths wide–over which flow conditions, including density, pressure, velocity, and temperature, change drastically. The image above shows a model of the Space Shuttle at a re-entry-like, high angle of attack at around Mach 20 in one of NASA Langley’s historic helium tunnels. The eerie glow outlining the shock structures around the model is a result of electron-beam fluorescence. In this flow visualization technique, a beam of high-energy electrons is swept over the model, causing the gas molecules to fluoresce according to temperature. (Photo credit: NASA Langley)

Huddling Penguins and Traffic Jams
Male emperor penguins have the unenviable task of incubating their eggs in temperatures as cold as -50 deg Celsius and winds of up to 200 km/h. To stay warm, the penguins form huddles of up to thousands of individuals. Observations in the wild show that these huddles move in a stop-and-go fashion, with changes propagating through the penguins like waves. Researchers adapted a model used for heavy traffic flow to describe the penguins’ motion. They found that motions like those found in observed penguin huddles could be initiated by slight movements of any penguin in the model huddle, regardless of its position; in other words, the huddle has no leader. They also found that the wave that travels through the penguins can align the huddle to uniform density or help two huddles merge. To learn more, check out the researchers’ video or their paper. (Video credit: D. Zitterbart et al./New Scientist; via J. Ouellette)
Collapsing Soap Bubbles
The colors of a soap film are directly related to their thickness. If a film becomes thin enough (~10 nanometers), it appears black. (Here’s why.) This video shows the thinning of a vertical soap film. Normally, this is a linear process, with gravity pulling the fluid downward and progressively thinning the film from top to bottom at a constant rate. At 0:20 a cold rod slowly contacts the film, adding a thermal driver for the film’s thinning. Two large counter-rotating convection cells form underneath the rod, with weaker secondary vortices in the lower corners of the film. This drastically increases mixing in the film. Gradually small black spots, indicating very thin areas of the film, form and advect. Eventually these spots stretch, forming long tails. The thinning of the film kicks up to an exponential rate until the film becomes uniformly thin. (Video credit: M. Winkler et al.)

Reader Question: What is Surface Tension?
Last week reader thesnazz asked:
Is there a difference between surface tension and viscosity, or are they two manifestations of the same process and/or principles? If you know a given fluid’s surface tension, can you predict its viscosity, and vice versa?
I’m tackling this one in parts, and you can click here to read about viscosity.
Surface tension’s intermolecular origins are a bit clearer than those of viscosity. Essentially, within the interior of a water drop, you can imagine water molecules all hanging out with other water molecules. They tug on one another, but because they are surrounded on all sides by other water molecules, the net force of all these interactions on any molecule is zero. Not so at the surface of the drop. The surface is also called an interface; it’s a place where the fluid ends and something else–another fluid or perhaps a solid–begins. For a water molecule at that interface, the forces exerted by neighboring molecules are not balanced to zero. Instead, the imbalance causes the water molecules to be tugged inward. We call this effect surface tension.
Because surface tension is an interfacial effect, it is not completely dependent on the fluid alone. For example, a drop of water sitting on a solid surface can take a variety of shapes depending on the properties of the solid (see also hydrophobicity) and the surrounding air as well as those of the water. This is only one of many manifestations of surface tension. Wikipedia has a pretty good overview of some others, if you’d like to learn more. Like viscosity, surface tension is usually measured rather than calculated from first principles.
In the end, both surface tension and viscosity have molecular origins, but they are two very different and independent properties. Viscosity is inherent to a fluid, whereas surface tension depends on the fluid and its neighboring substance. Both quantities are more easily measured than calculated. Thanks again to thesnazz for a great question! As always, you can ask questions or submit post ideas here on Tumblr or via Twitter or email. (Image credit: Wikimedia)

Reader Question: What is Viscosity?
Reader thesnazz asks:
Is there a difference between surface tension and viscosity, or are they two manifestations of the same process and/or principles? If you know a given fluid’s surface tension, can you predict its viscosity, and vice versa?
This is a good question! To answer it, let’s think about where surface tension and viscosity come from. Like many concepts in fluid dynamics, these quantities describe for a whole fluid the properties that arise from interactions between molecules.
To prevent this becoming overly long, I’m going to tackle this over a couple posts. Today, I’ll talk about viscosity.
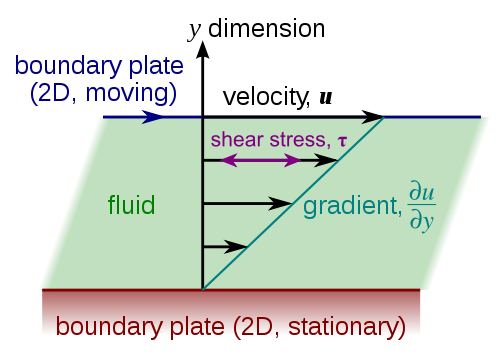
One way to describe a fluid’s viscosity is as a measure of its resistance to deformation. Another way to think of it is how easily momentum is transmitted from one part of the fluid to another. The diagram above is the classic representation. A layer of fluid is sandwiched between two flat plates. If the top plate moves, friction requires that the fluid particles in contact with the plate get dragged along. This shears the fluid just below that and drags it along, but not quite as much. Those fluid particles do the same to their neighbors and so on down to the stationary second plate, where the fluid is at rest.
Viscosity is the property that determines how much those neighboring fluid particles move; the more viscous the fluid, the more the neighboring bits of fluid resist getting pulled along. This is a property that’s inherent to a fluid. It comes from how the molecules of the fluid interact with one another, but there are no simple expressions to calculate the viscosity of a liquid or a gas from the individual interactions of its molecules. Instead we experimentally measure viscosity values and use empirical formulas to approximate how viscosity changes with temperature and other effects. (Image credit: Wikimedia)

Bullet Through a Bubble
A bullet passes through a soap bubble in the schlieren photo above. The schlieren optical technique is sensitive to changes in the refractive index and, since a fluid’s refractive index changes with density, permits the visualization of shock waves. A strong curved bow shock is visible in front of the bullet as well as weaker lines marking additional shocks waves around the bullet. Impressively, the bullet’s passage is so fast (and the photo’s timing so perfect) that there are no imperfections or signs of bursting in the soap bubble. The photo’s caption suggests that the bubble may be filled with multiple gases. If they are unmixed and of differing densities, this may be the source of the speckling and plume-like structures inside the bubble. Incidentally, if anyone out there has high-speed schlieren video of a bullet passing through a soap bubble, I would love to see it. (Photo credit: H. Edgerton and K. Vandiver)
Fluctuating Ferrofluids
Ferrofluids–liquids seeded with magnetically sensitive ferrous nanoparticles–demonstrate some beautiful and bizarre behaviors when exposed to magnetic fields. This video shows the reaction of a pool of ferrofluid to the magnetic field generated by an alternating current through a simple wire coil. At 1 Hz, the fluid response is not unlike the normal-field instability–the characteristic spikes–the fluid develops when exposed to a permanent magnet. But because field is fluctuating, the spikes pop out and fade again. At 10 Hz, the behavior gets even more interesting. As the frequency of the magnetic field’s oscillation increases, the time the fluid has to respond to changes in the magnetic field decreases. Eventually, one can imagine a point where the magnetic field oscillates faster than the molecules in the fluid can rearrange themselves to respond. It’s unclear if such a mismatch in timescales is the cause of the increasing violence of the ferrofluid’s response in the later clips or whether this results from an unmentioned change to the current through the coil. For something even wilder, check out Nick’s video of the ferrofluid’s response to music. (Video credit: N. Moore)
Vibrating Paint
Paint is probably the Internet’s second favorite non-Newtonian fluid to vibrate on a speaker–after oobleck, of course. And the Slow Mo Guys’ take on it does not disappoint: it’s bursting (literally?) with great fluid dynamics. It all starts at 1:53 when the less dense green paint starts dimpling due to the Faraday instability. Notice how the dimples and jets of fluid are all roughly equally spaced. When the vibration surpasses the green paint’s critical amplitude, jets sprout all over, ejecting droplets as they bounce. At 3:15, watch as a tiny yellow jet collapses into a cavity before the cavity’s collapse and the vibration combine to propel a jet much further outward. The macro shots are brilliant as well; watch for ligaments of paint breaking into droplets due to the surface-tension-driven Plateau-Rayleigh instability. (Video credit: The Slow Mo Guys)

Pitcher Plant Fluid Dynamics
Carnivorous pitcher plants owe much of their efficacy to the viscoelasticity of their digestive fluid. A viscoelastic fluid’s resistance to deformation has two components: the usual viscous component that resists shearing and an elastic component, often derived from the presence of polymers, that resists stretching – kind of like a liquid rubber band. It’s the latter effect that’s important when it comes to the pitcher plant trapping insects. When a fly or ant falls into the liquid within the plant, it will flail and try to swim, thereby straining the fluid. In part © of the image above, you can see how long fluid filaments stretch as the fly moves; this is because the digestive fluid’s extensional viscosity, the elastic component, is 10,000 times larger than its shear viscosity, the usual viscous component, for motions like the fly’s. This viscoelastic fluid is so effective at trapping insects that, as seen in part (b) above, it has to be diluted by more than 95% before insects can escape it! (Image credit: L. Gaume and Y. Forterre)


