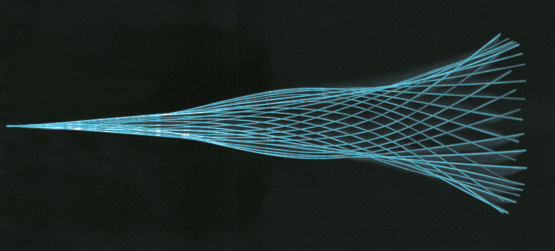
Tag: science

  • Featured Video Play Icon

    Burning a Rocket Underwater

    In a recent video, Warped Perception filmed a model rocket engine firing underwater. Firstly, it’s no surprise that the engine would still operate underwater (after its wax waterproofing). The solid propellant inside the engine is a mixture of fuel and oxidizer, so it has all the oxygen it needs. Fluid dynamically speaking, though, this high-speed footage is just gorgeous.

    Ignition starts at about 3:22 with some cavitation as the exhaust gases start flowing. Notice how that initial bubble dimples the surface when it rises (3:48). At the same time, the expanding exhaust on the right side of the tank is forcing the water level higher on that side, triggering an overflow starting at about 3:55. At this point, the splashes start to obscure the engine somewhat, but that’s okay. Watch that sheet of liquid; it develops a thicker rim edge and starts forming ligaments around 4:10. Thanks to surface tension and the Plateau-Rayleigh instability, those ligaments start breaking into droplets (4:20). A couple seconds later, holes form in the liquid sheet, triggering a larger breakdown. By 4:45, you can see smoke-filled bubbles getting swept along by the splash, and larger holes are nucleating in that sheet.

    The second set of fireworks comes around 5:42, when the parachute ejection charge triggers. That second explosive triggers a big cavitation bubble and shock wave that utterly destroys the tank. If you look closely, you can see the cavitation bubble collapse and rebound as the pressure tries to adjust, but by that point, the tank is already falling. Really spectacular stuff!  (Video and image credit: Warped Perception)

  • Featured Video Play Icon

    The Elastic Leidenfrost Effect

    Drop some hydrogel beads in a hot frying pan and they’ll bounce, hiss, and screech. Normally, if you drop a ball, it bounces to ever smaller heights until it comes to rest. In contrast, on a hot surface the hydrogel can bounce to a steady height for minutes at a time, raising a question: where does it get the energy for its incessant bounce? 

    Upon close examination of the impact, researchers found the hydrogel beads are actually slapping the surface over and over on each bounce. The frequency of the slapping exactly matches that of the audible screech, so what you’re actually hearing is this bounce-slap. Now what causes the slapping?

    Contact with the hot surface vaporizes some of the water inside the hydrogel. If it were a droplet, this vapor would form a thin, almost frictionless layer the droplet could glide on; that’s the classic Leidenfrost effect. Here the shell of the bead prevents that until the pressure really builds up. When the pressure gets high enough, the vapor finally escapes, opening up a gap. As the gap reaches its largest point, the bead rebounds elastically, bringing it back in contact with the surface and starting the process again. Each of these cycles acts like a tiny engine, harvesting energy that drives the larger bounce. This elastic Leidenfrost effect may be particularly helpful in soft robotics, providing robots with a new mechanism for movement. (Image and video credit: S. Waitukaitis et al.,arXiv)

  • Impressionist Gibraltar

    Impressionist Gibraltar

    Swirls of phytoplankton make this satellite image of Gibraltar look like an Impressionist painting. The photo is a composite of data from several instruments, with colors enhanced to highlight features of the phytoplankton blooms. The tiny plankton act as tracer particles that reveal some of the complex flow between the North Atlantic and the Mediterranean. Although narrow, the Strait at Gibraltar has deep and complex terrain that was formed during a breach flood event millions of years ago. Water flowing through that terrain sets up enormous and complicated waves well beneath the ocean surface. These drive some of the turbulence that we see here as the blue swirls east of the Strait. (Image credit: NASA/N. Kurig; via NASA Earth Observatory)

  • Featured Video Play Icon

    Kelvin-Helmholtz Instability

    Sixty Symbols has a great new video explaining the laboratory set-up for demoing a Kelvin-Helmholtz instability. You can see a close-up from the demo above. Here the pink liquid is fresh water and the blue is slightly denser salt water. When the tank holding them is tipped, the lighter fresh water flows upward while the salt water flows down. This creates a big velocity gradient and lots of shear at the interface between them. The situation is unstable, meaning that any slight waviness that forms between the two layers will grow (exponentially, in this case). Note that for several long seconds, it seems like nothing is happening. That’s when any perturbations in the system are too small for us to see. But because the instability causes those perturbations to grow at an exponential rate, we see the interface go from a slight waviness to a complete mess in only a couple of seconds. The Kelvin-Helmholtz instability is incredibly common in nature, appearing in clouds, ocean waves, other planets’ atmospheres, and even in galaxy clusters! (Image and video credit: Sixty Symbols)

  • Featured Video Play Icon

    How Smoke Rings Work

    Vortices are a ubiquitous part of life, whether they’re draining down your bathtub or propelling underwater robots. In the latest video from the Lib Lab project, you can learn about how vortex rings form, what makes them last so long, and even make a vortex generator of your own. I can personally attest that vortex cannons are good for hours of entertainment, no matter your age. They’re even more fun with friends, as the Oregon State drumline demonstrates in the video. Want even more vortex fun? Check out leapfrogging vorticesvortex rings colliding head-on, and a giant 3 meter wide vortex cannon in action. (Video and image credit: Lib Lab)

  • Hagfish Crash

    Hagfish Crash

    Last week a flatbed truck in Oregon overturned and released 3400 kilograms of live hagfish on the highway and nearby cars. Hagfish are eel-like fish known for their impressive slime production. When threatened, the hagfish produce mucins that, when combined with water, form an extremely viscoelastic mucus. As it’s stretched, the mucus thickens and becomes more viscous. Normally, hagfish use this property to clog the gills of fish trying to eat them. The slime is weak, however, to shearing; hagfish actually tie themselves in knots to slide the slime off when there’s too much of it. The Oregon Department of Transportation managed to clear the road of mucus (and hagfish) using bulldozers and fire hoses, but it did take them several hours. For more photos and videos from the incident, check out Gizmodo and the Oregon State Police Twitter feed. (Image credit: Oregon State Police; via Gizmodo)

  • Equatorial Streaming

    Equatorial Streaming

    Here you see a millimeter-sized droplet suspended in a fluid that is more electrically conductive than it. When exposed to a high DC electric field, the suspended drop begins to flatten. A thin rim of fluid extends from the drop’s midplane in an instability called “equatorial streaming”. As seen in the close-up animation, the rim breaks off the droplet into rings, which are themselves broken into micrometer-sized droplets thanks to surface tension. The result is that the original droplet is torn into a cloud of droplets a factor of a thousand smaller. This technique could be great for generating emulsions of immiscible liquids–think vinaigrette dressing but with less shaking! (Image credit: Q. Brosseau and P. Vlahovska, source)

  • The Winds of Mars

    The Winds of Mars

    The Martian atmosphere is scant compared to Earth’s, but its winds still sculpt and change the surface regularly. The average atmospheric pressure on Mars is only 0.6% of Earth’s, and the density is similarly low at 1.7% of Earth’s. Despite this thinness, Martian winds are still substantial enough to shift sands on a daily basis, as shown above. These two images were taken one Martian day apart, showing how sand ripples moved and how the Curiosity rover’s tracks can be quickly obscured. Part of the reason Mars’ scant atmosphere is still so good at moving sand is that Martian gravity is roughly one-third of ours; if the sand is lighter, it doesn’t take as much force to move! (Image credit: NASA/JPL-CALTECH/MSSS)

  • Break-Up of the Chelyabinsk Meteor

    Break-Up of the Chelyabinsk Meteor

    In 2013, a meteor about 20-meters in diameter broke up over Chelyabinsk, Russia in a dramatic display that damaged buildings within 100 km and injured more than 1200 people. To better understand the threat presented by such objects, NASA has been conducting 3D, hypersonic simulations like the one shown here. The meteor material is shown in gray and black. Brighter colors like red and yellow indicate the hot, high-pressure shock wave caused when the meteor slams into the atmosphere. Aerodynamic effects quickly erode the meteor, ripping it into pieces that disperse energy explosively in the atmosphere. While you might think the meteor breaking up is good for us, it’s actually the blast waves from its break-up that cause the most damage.  (Image and video credit: NASA, source; via Gizmodo)

  • Reader Question: Drafting in Time Trials

    Reader Question: Drafting in Time Trials

    In a comment on this recent post regarding drafting advantages to a leader, reader fey-ruz asks:

    in cycling, team follow cars are required to maintain a minimum distance from their riders during time trials for this very reason (although i imagine the effects in that context are much smaller and dependent on the conditions, esp the wind speed, direction, and strength). FYFD, is there a simple way to understand where this upstream influence comes from? or a specific term in the navier-stokes equations that it results from?

    Cars following riders during a time trial can actually make a huge difference! One study from a couple of years ago estimated that a car following a rider in a short (13.8 km) time trial could take 6 seconds off the rider’s time. The images up top show a simulation from that study with a car following at 5 meters versus 10 meters. The colors indicate the pressure field around the car and rider. Red is high pressure, blue is low pressure. Both the car and the rider have high pressure in front of them; you can think of this as a result of them pushing the air in front of them.

    A large part of the rider’s drag comes from the difference in pressure ahead and behind them. (For a look at flow around a cyclist that focuses on velocity instead, check out my video on cycling aerodynamics.) When a car drives close behind a cyclist, it’s essentially pushing air ahead of it and into the cyclist’s wake. This actually reduces the difference in pressure between the cyclist’s front and back sides, thereby reducing his drag. Because cars are large, they have an oversized effect in this regard, but having a motorbike or another rider nearby also helps the lead cyclist aerodynamically.

    As for the Navier-Stokes equation – this effect isn’t one that you can really pin down to a single term since it’s a consequence of the flow overall. (Image credits: TU Eindhoven; K. Ramon)