One of my favorite things to do while we were sailing along the Galapagos was watching the blue-footed boobies hunt. Like the gannets shown above, boobies are plunge divers. They circle overhead until they spot their prey, then they fold their wings and dive headfirst into the water, impacting at speeds of more than 20 m/s (~45 mph). It’s absolutely incredible to watch. The physics involved are impressive, too, especially considering how badly a human would be injured diving at their speeds!
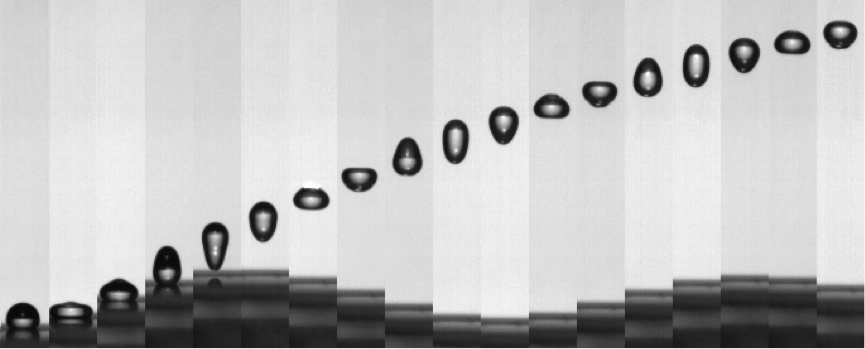
Fluid dynamically speaking, there are three important phases to the birds’ entry. The first is the impact phase, which lasts from initial contact until the bird’s head is underwater. In the second phase, an air cavity forms behind the head and around the neck as it enters the water. Finally, when the chest – the widest point of the bird – hits the water, the bird reaches the submerged phase.
Mechanically, the most interesting part is the air cavity phase. During this time, the bird’s head is slowing down due to high hydrodynamic drag from the water, but the rest of the bird is still moving fast. That means the bird’s slender neck experiences strong compressive forces, which would tend to make it buckle. Researchers at Virginia Tech examined this very problem and found that the birds’ sizing – its head shape, neck length, and so forth – combined with their typical diving speeds kept these birds well away from the conditions that would cause their necks to buckle. With the added stabilization from the birds’ neck muscles, they estimated that gannets and other plunge divers might be able to safely dive at speeds twice what would kill a human! Check out the BBC video below to see high-speed footage of gannets diving. (Image credits: G. Lecoeur; B. Chang et al.; research credits: B. Chang et al., pdf; video credit: BBC)
Tomorrow will be the final day of Galapagos Week. Catch up on previous posts here.