Von Karman vortex streets are a pattern of alternating vortices shed in the wake of a bluff body. They’re commonly associated with cylinders and can be demonstrated in simulation and in the lab. (They even show up in supersonic flows.) But they also show up in nature quite frequently, like in this cloud pattern off Central America. Such wakes often occur downstream of rocky, volcanic islands that rise above the smooth ocean surface and disrupt the atmosphere’s boundary layer. The same phenomenon is responsible for the “singing” of electrical lines on a windy day, and I’ve even heard it make the spokes on my bicycle wheel sing in a crosswind. (Photo credit: R. Mastracchio; via @BadAstronomer; submitted by jshoer)
Tag: physics

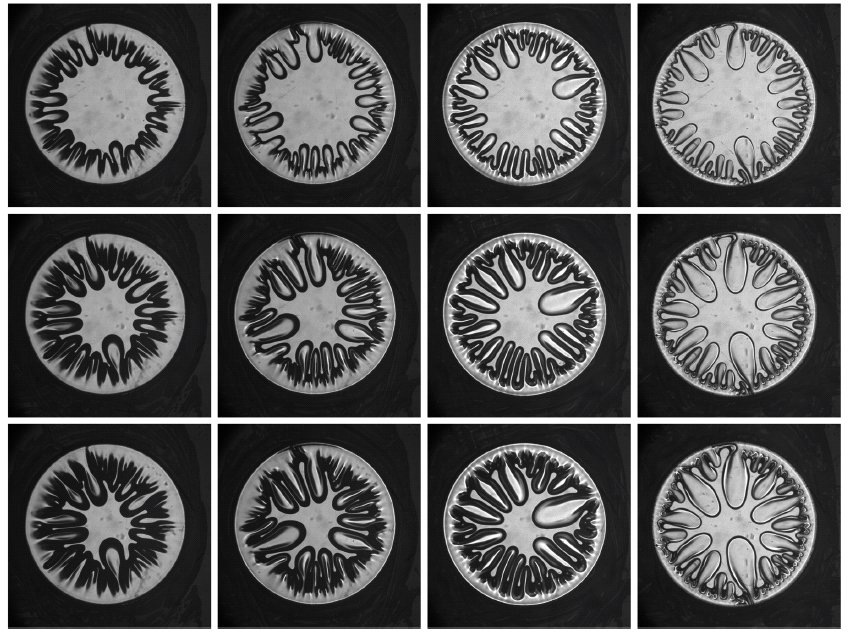
Viscous Fingers
Viscous liquid placed between two plates forms a finger-like instability when the top plate is lifted. The photos above show the evolution of the instability for four initial cases (top row, each column) in which the initial gap between the plates differs. Each row shows a subsequent time during the lifting process. As the plate is pulled up, the viscous liquid adheres to it and air from the surroundings is entrained inward to replace the fluid. This forms patterns similar to the classic Saffman-Taylor instability caused when less viscous fluid is injected into a more viscous one. (Photo credit: J. Nase et al.)

Bursting a Bubble
Though seemingly instantaneous to the naked eye, the bursting of a soap bubble is fascinating when slowed down. Here it is at about 2200 frames per second. Initially, the bubble is approximately spherical – its shape determined by a balance between surface tension, gravity, and pressure. The prick of a pinpoint disrupts the balance, and surface tension pulls the thin film away from the defect. The liquid sheet of the bubble retracts swiftly into a filament of fluid and a cloud of tiny droplets. (Video credit: soapbubble.dk)
Instability
[original media no longer available]
Many systems can exhibit unstable behaviors when perturbed. The classic example is a ball sitting on top of a hill; if you move the ball at all, it will fall down the hill due to gravity. There is no way to perturb the ball in such a way that it will return to the top of the hill; this makes the top of the hill an unstable point. In many dynamical systems, a very small perturbation may not be as obviously unstable as the ball atop the hill, especially at first. Often a perturbation will have a very small effect initially, but it can grow exponentially with time. That is the case in this video. Here a tank of fluid is being vibrated vertically with a constant amplitude. At first, the sloshing effect on the fluid interface is very small. But the vibration frequency sits in the unstable region of the parameter space, and the perturbation, which began as a small sloshing, grows very quickly. In a real system (as opposed to a mathematical one), this kind of unstable or unbounded growth very quickly leads to destruction. (Video credit: S. Srinivas)
Balloons in the Car
Destin from Smarter Every Day has just made a video on one of my favorite fluids brain teasers: what happens to a helium balloon when you accelerate in a car? Take a moment to think about the answer before watching or reading further…
Okay, so what happens? Contrary to what you may expect, hitting the accelerator with a balloon in the car will make it shift forward. This is a matter of buoyancy. As Destin demonstrates with the water bottle, when two fluids are accelerated forward, the denser one will shift backwards, which pushes the lighter one forward. Because the helium is lighter than the air filling the car, accelerating pushes the air backward (just as it does the pendulum and the car’s inhabitants) and that shifting of the air pushes the helium in the balloon forward. (Video credit: Smarter Every Day)
Rubens’ Table
Veritasium’s new video has an awesome demonstration featuring acoustics, standing waves, and combustion. It’s a two-dimensional take on the classic Rubens’ tube concept in which flammable gas is introduced into a chamber with a series of holes drilled across the top. Igniting the gas produces an array of flames, which is not especially interesting in itself, until a sound is added. When a note is played in the tube, the gas inside vibrates and, with the right geometry and frequency, can resonate, forming standing waves. The motion of the gas and the shape of the acoustic waves is visible in the flames. Extended into two-dimensions, this creates some very cool effects. (Video credit: Veritasium; via Ryan A.; submitted by jshoer)

Rebounding
A water droplet can rebound completely without spreading from a superhydrophobic surface. The photo above is a long exposure image showing the trajectory of such a droplet as it bounces. In the initial bounces, the droplet leaves the surface fully, following a parabolic path with each rebound. The droplet’s kinetic energy is sapped with each rebound by surface deformation and vibration, making each bounce smaller than the last. Viscosity damps the drop’s vibrations, and the droplet eventually comes to rest after twenty or so rebounds. (Image credit: D. Richard and D. Quere)

Growing Turbulence

Flow patterns can change dramatically as fluid speed and Reynolds number increase. These visualizations show flow moving from left to right around a circular plunger. The lower Reynolds number flow is on the left, with a large, well-formed, singular vortex spinning off the plunger’s shoulder. The image on the right is from a higher Reynolds number and higher freestream speed. Now the instantaneous flow field is more complicated, with a string of small vortices extending from the plunger and a larger and messier area of recirculation behind the plunger. In general, increasing the Reynolds number of a flow makes it more turbulent, generating a larger range of length scales in the flow and increasing its complexity. (Image credit: S. O’Halloran)
“Becoming Harmonious”
Much as I try to keep from getting repetitious, this was just too neat to pass up. This new music video for The Glitch Mob’s “Becoming Harmonious” is built around the standing Faraday waves that form on a water-filled subwoofer. The vibration patterns, along with judicious use of strobe lighting, produce some fantastic and kaleidoscopic effects. (Video credit: The Glitch Mob/Susi Sie; submitted by @krekr)
Tiny Fliers
There’s an apocryphal story claiming that, aerodynamically speaking, honeybees should not be able to fly. Obviously, they can, but it’s true that a small, flapping creature and a large, fixed-wing aircraft will not generate lift exactly the same way. NYU professor Leif Ristroph has a lot of projects exploring flapping flight on smaller scales, as seen in this video. His oscillatory fliers and rotating flapping flight simulator have both been featured previously. Part of the beauty of these projects is their size; in a field that’s historically required giant wind tunnels and room-length wave tanks, Ristroph’s work provides insight into long-standing problems using apparatuses that fit on a countertop. (Video credit: Cool Hunting/L. Ristroph et al.)