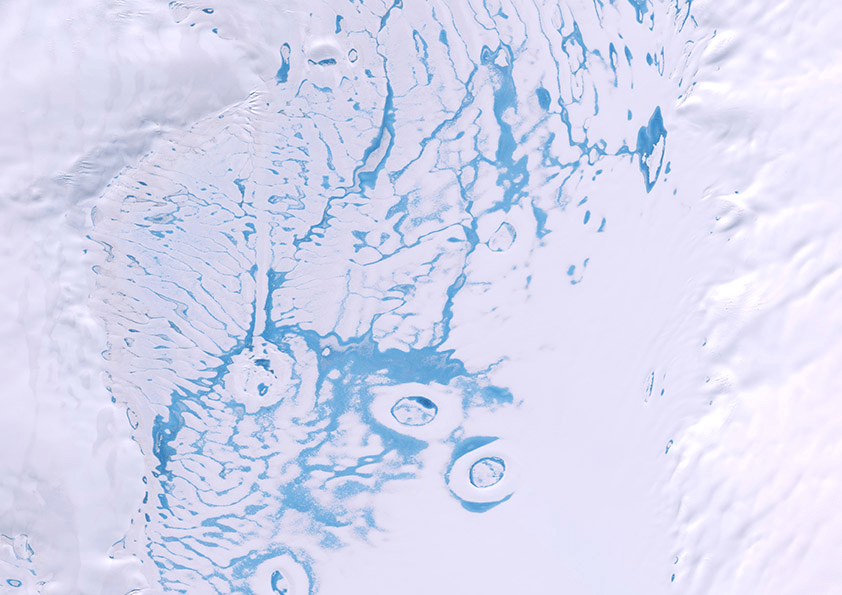
The low sun angle in this astronaut photo of Junggar Basin shows off the wind- and water-carved landscape. Located in northwestern China, this region is covered in dune fields, appearing along the top and bottom of the image. The uplifted area in the top half of the image is separated by sedimentary layers that lie above the reddish stripe in the center of the photo. Look closely in this middle area, and you’ll find the meandering banks of an ephemeral stream. Then the landscape transitions back into sandy wind-shaped dunes. (Image credit: NASA; via NASA Earth Observatory)
Tag: geophysics

“Stomp-Rocket”: A New Type of Eruption
When Kilauea‘s caldera collapsed in 2018, it came with a sequence of 12 closely-timed eruptions that did not match either of the typical volcanic eruption types. Usually, eruptions are either magmatic — caused by rising magma — or phreatic — caused by groundwater flash-boiling into steam. The data from Kilauea matched neither type.
Instead, scientists proposed a new model for eruption, based around a mechanism similar to the stomp-rockets that kids use. They suggested that, before the eruption, Kilauea’s magma reservoir contained a mixture of magma and a pocket of gas. When part of the magma reservoir collapsed, the falling rock compressed the gases in the chamber — much the way a child’s foot compresses the air reservoir of a stomp rocket — building up enough gas pressure to explosively launch debris and hot gas up to the surface.
The team found that computer simulations of this new eruption model matched well with observations and measurements taken at Kilauea in 2018. Kilauea is one of the most closely monitored volcanoes in the world; although the team suspects this mechanism occurs during caldera collapse of other volcanoes, it’s unlikely they could have pieced together such a convincing case for an eruption anywhere else. (Image credit: O. Holm; research credit: J. Crozier et al.; via Physics World)

Venusian Lava Flows
Venus is often known as Earth’s twin, given its similar size and proximity. But, thanks to its runaway greenhouse effect, Venus is a hellish landscape buried beneath a hot atmosphere of carbon dioxide and sulfuric acid. Unlike Earth, Venus is not tectonically active, though it does have active volcanoes. A recent study re-examined synthetic aperture radar data from the Magellan spacecraft mission in the early 1990s and found that the data contained evidence of fresh lava flows.
The team found two areas near volcanoes where the surface backscatter changed significantly between orbital observations. After examining many possible explanations for the changes, the team concluded that the differences were most likely due to new lava. They even performed the same analysis for a volcanic field here on Earth between known lava flows and observed the same behavior. Combined with another recent study that found evidence of volcanic activity in Magellan data, signs are pointing toward Venus being about as volcanically active as our own planet, even if the mechanisms driving the volcanism differ. (Image credit: NASA/JPL-Caltech; research credit: D. Sulcanese et al.; via Gizmodo)

Slipping Along Enceladus
Home to a sub-surface ocean, Saturn‘s moon Enceladus is a fascinating candidate for life in our solar system. As it orbits Saturn, plumes periodically shoot out long surface features known as tiger stripes that sit near the icy moon’s southern pole. A recent study, based on numerical simulation, suggests a geophysical mechanism that could account for the plumes.
The team suggests that, like the San Andreas Fault, the tiger stripes are a fault subject to strike-slip motion. In this type of fault, the ice on either side meets along a vertical face and the two sides will slide past one another in opposite directions. As Enceladus orbits, its proximity to Saturn causes tidal compression across the fault that modulates how much slip motion occurs. In their model, the authors found that strike-slip motion would intermittently open gaps in the fault that would allow water from the subsurface ocean to create plumes at intervals consistent with those observed. (Image credit: top – NASA/JPL-Caltech/Space Science Institute, illustration – A. Berne et al.; research credit: A. Berne et al.; via Gizmodo)

Illustration of the strike-slip mechanism over the course of Enceladus’s tides. The two sides of the “tiger stripe” fault move in opposite directions. How much they move depends on the amount of tidal compression caused by Enceladus’s orbit around Saturn. At times, motion along the fault pulls apart narrow sections of the ice, allowing a plume to spray out. 
“Serenity”
Peering from directly above, landscapes take on a whole different aspect. That idea is the heart of Vadim Sherbakov’s “Serenity,” filmed by drone. From seething waters and meandering rivers to eroded landscapes and twisting ice, there’s lots of fluid dynamics on display here. (Video and image credit: V. Sherbakov)

Geyser Sculptures
In the remote landscape of Tajikistan, photographer Øystein Sture Aspelund discovered a small geyser near a high-altitude lake. With a fast shutter, he “froze” the shapes of the eruption, capturing bubbly columns, mushrooms, and splashes. I love the sense of texture here. Aspelund’s photographs really highlight the difference between a geyser and an artificial fountain: bubbles. Geysers erupt because of the buildup of steam and pressure in their underground plumbing. Those bubbles are the signature of that process. (Image credit: Ø. Aspelund; via Colossal)

Reimagining Mars’ Interior
Older models of Mars assumed a liquid metal core beneath a solid mantle of silicates, but recent studies indicate that structure is missing at least one layer. Using data from the InSight lander’s seismometer, two teams independently calculated that a liquid silicate layer must surround the planet’s core. In September 2021, three meteorite pieces impacted Mars far from the InSight lander’s position. Since the Mars Reconnaissance Orbiter could exactly pinpoint the impact location, researchers were able to calculate just how long it took seismic waves from the impact to reach the lander.
Like on Earth, Mars has two varieties of seismic wave: transverse S-waves that only travel through solids and longitudinal P-waves that travel through both liquid and solid layers. S-waves reflect off any liquid-solid boundary, following a different path to a seismometer than P-waves that refract across the boundary and travel through liquid. For more of the story behind this discovery, check out this article at Physics Today. (Image credit: Mars – NASA/JPL-Caltech/University of Arizona, illustration – J. Sieben/J. Keisling; research credit: H. Samuel et al. and A. Khan et al.; via Physics Today)

An illustration of Mars’ interior and the paths followed by seismic waves before InSight picked them up. 
Fire in Ice
This false-color satellite image of Malaspina Glacier (Sít’ Tlein) is a riot of color. Composed of coastal/aerosol, near infrared, and shortwave infrared bands from Landsat 9, the colors highlight features otherwise hard to identify. Watery features appear in reds, oranges, and yellows; vegetation is green and rock appears in blue. The glacier covers more than 4000 square kilometers, an area larger than the state of Rhode Island. The dark lines atop the glacier are moraines, where rock, soil, and other debris has been scraped up along the glacier’s edge. Over time, changes in the glacier’s velocity cause the moraines to fold and shear, creating the zigzag pattern seen here. (Image credit: W. Liang; via NASA Earth Observatory)

Dancing Peanuts
Bartenders in Argentina sometimes entertain patrons by tossing a few peanuts into their beer. Initially, the peanuts sink, but after a few seconds they rise, wreathed in bubbles. Once on the surface, they roll, causing the bubbles to pop, and the peanut sinks once again. The cycle repeats, sometimes for as long as a couple hours.
There are a couple physical processes governing this dance. The first is bubble nucleation. Most beers are carbonated; they contain dissolved carbon dioxide gas that remains in solution while the beer is under pressure. Once poured, that storage pressure is gone and bubbles start to form in the liquid. The shape of the peanut means that bubbles form more easily on it than on the glass walls or in the liquid. And once the peanut is covered in bubbles, buoyancy comes into play. The bubbles attached to the peanut reduce its density relative to the surrounding fluid, enabling the peanut to rise up and float.
This same process is seen with other objects in carbonated fluids, too, such as blueberries in beer and lemon seeds in carbonated water. But it’s also reflected elsewhere in nature. For example, magnetite crystals are thought to float in magma due to a similar nucleation of dissolved gases on their surface. (Image and research credit: L. Pereira et al.; via APS Physics)

Underwater Volcanic Flows
The Hunga Tonga–Hunga Ha’apai volcanic eruption in December 2021 was the most violent in 140 years, and we are still learning from its aftermath. A recent study focuses on the eruption’s incredible underwater flows, which damaged nearly 200 kilometers of underwater cables. From the cables’ locations and the time of service loss, the team calculated that gravity currents hit the cables at speeds as high as 122 kilometers per hour and with run-outs that lasted over 100 kilometers. These fast flows were triggered by material from the volcanic plume falling into the ocean, causing dense flows that swept down the submerged slopes of the volcano and seafloor.

Illustration of volcanic plume material falling into the ocean and triggering underwater flows. Previously, a landslide broke underwater telegraph cables off Newfoundland and a coastal construction accident severed a cable in the Mediterranean. But neither of those incidents revealed the same level of speed, distance, and destructive capacity as the Tongan eruption. It seems that these underwater gravity currents pose an ongoing threat to submerged infrastructure. As more cables are laid in volcanically-active regions of the Pacific, we will need more extensive mapping and monitoring of the seafloor to protect against future disruptions. (Image credit: eruption – Tonga Geological Services, illustration – APS/C. Cain; research credit: M. Clare et al.; via APS Physics)


