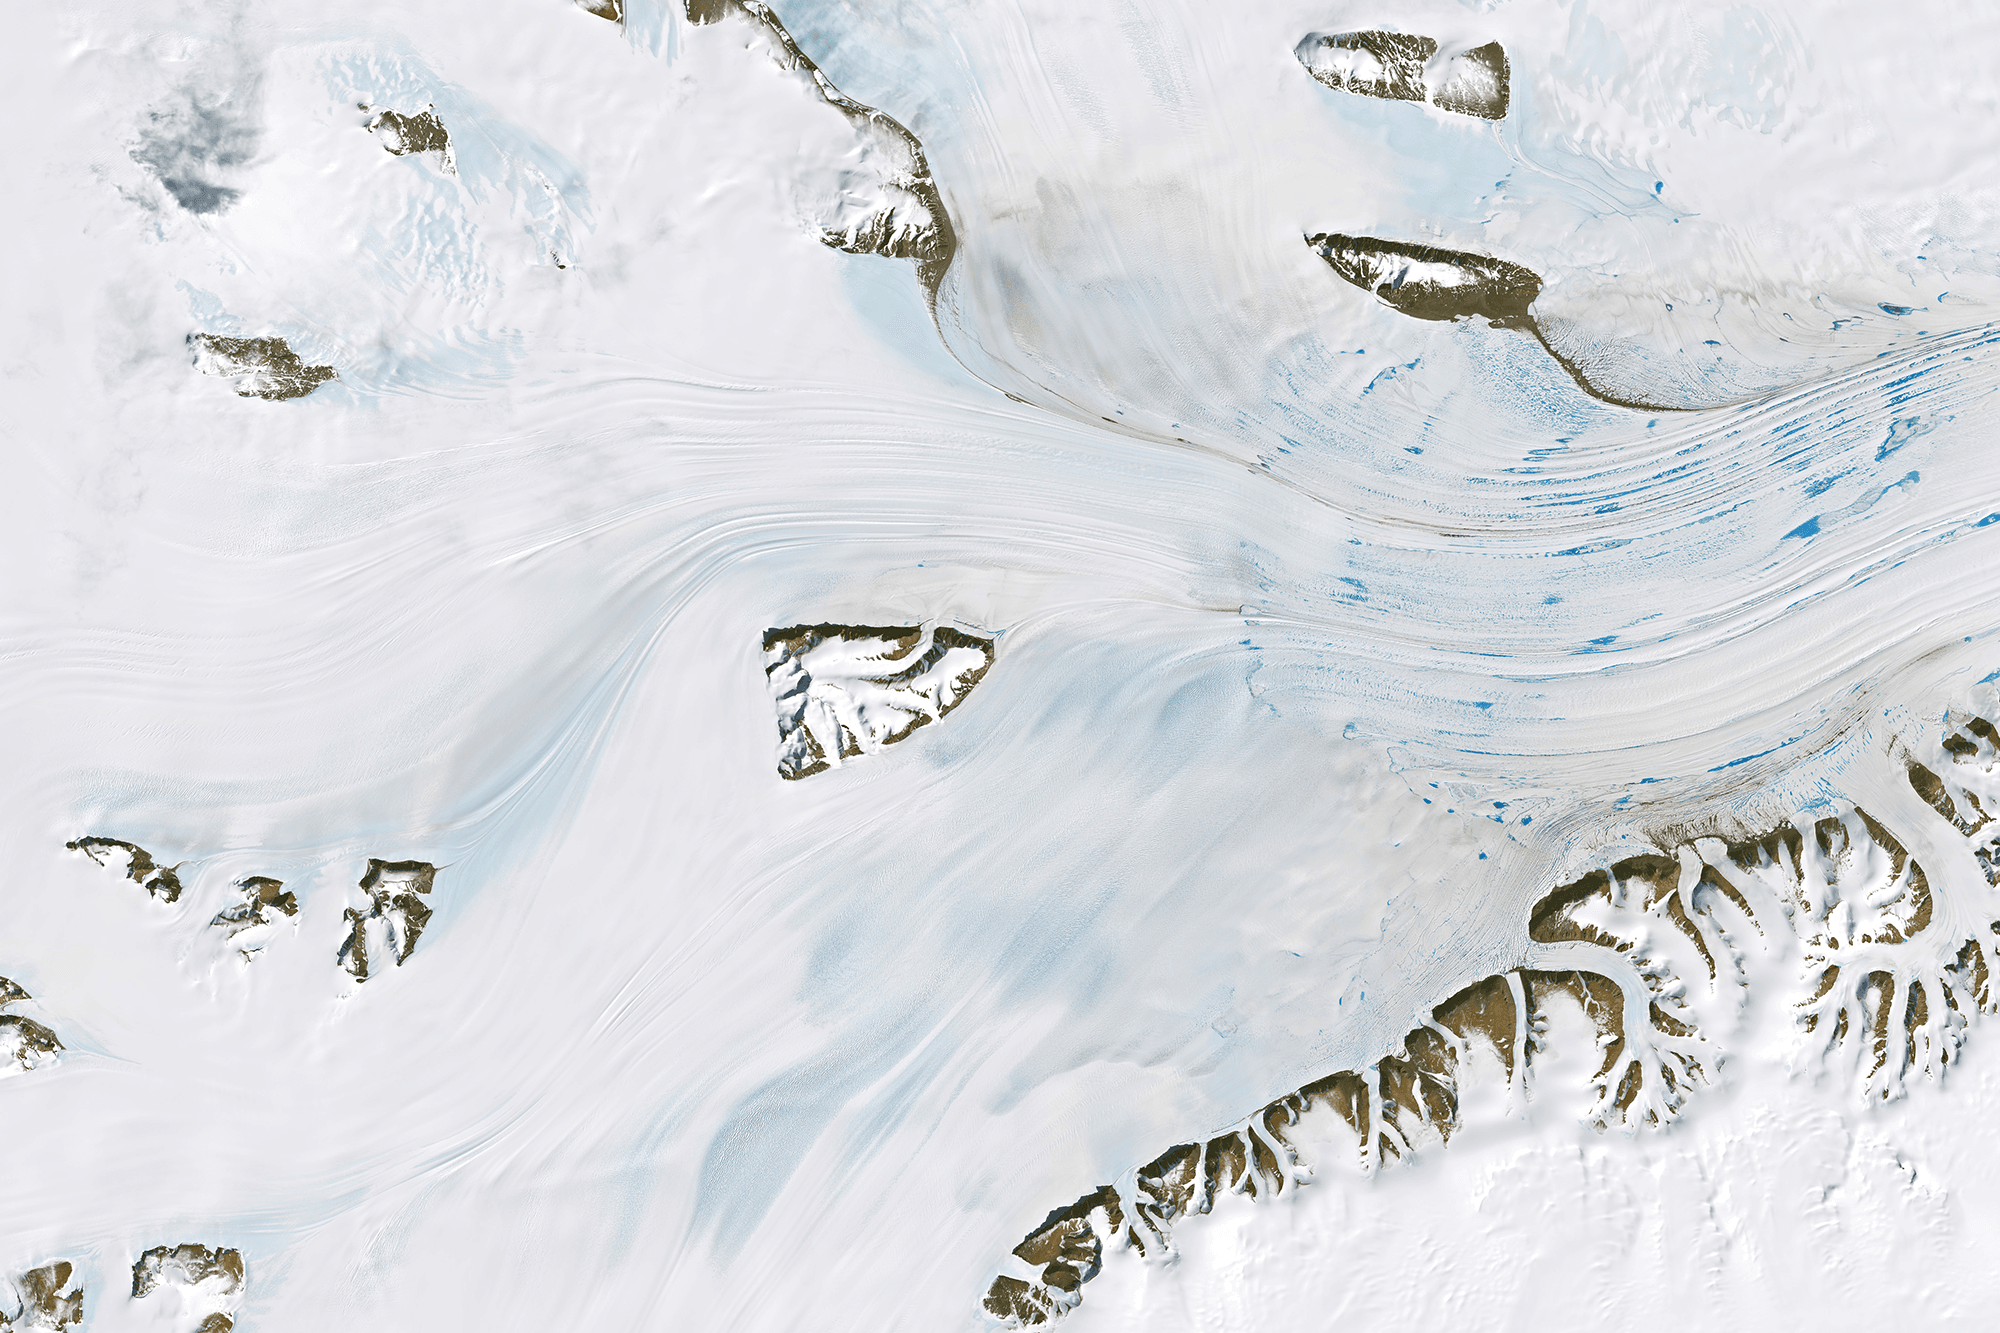
Glaciers flow together and march out to sea along the Amery Ice Shelf in this satellite image of Antarctica. Three glaciers — flowing from the top, left, and bottom of the image — meet just to the right of center and pass from the continental bedrock onto the ice-covered ocean. The ice shelf is recognizable by its plethora of meltwater ponds, which appear as bright blue areas. Each austral summer, meltwater gathers in low-lying regions on the ice, potentially destabilizing the ice shelf through fracture and drainage. This region near the ice shelf’s grounding line is particularly prone to ponding. Regions further afield (right, beyond the image) are colder and drier, often allowing meltwater to refreeze. (Image credit: W. Liang; via NASA Earth Observatory)
Tag: geophysics

Non-Newtonian Effects in Magma Flows
As magma approaches the surface, it forces its way through new and existing fractures in the crust, forming dikes. When a volcano finally erupts, the magma’s viscosity is a major factor in just how explosive and dangerous the eruption will be, but a new study shows that what we see from the surface is a poor predictor of how magma actually flows within the dike.
Researchers built their own artificial dike using a clear elastic gelatin, which they injected water and shear-thinning magma-mimics into. By tracking particles in the liquids, they could observe how each liquid followed on its way to the surface. All of the liquids formed similar-looking dikes at a similar speed, but within the dike, the liquids flowed very differently. Water cut a central jet through the gelatin, then showed areas of recirculation along the outer edges. In contrast, the shear-thinning liquids — which are likely more representative of actual magma — showed no recirculation. Instead, they flowed through the dike in a smooth, fan-like shape.
The team cautions that surface-level observations of developing magma dikes provide little information on the flow going on underneath. Instead, their results suggest that volcanologists modeling magma underground should take care to include the magma’s shear-thinning to properly capture the flow. (Image credit: T. Grypachevska; research credit: J. Kavanagh et al.; via Eos)
Fediverse Reactions
-

On the Mechanics of Wet Sand


Sand is a critical component of many built environments. As most of us learn (via sand castle), adding just the right amount of water allows sand to be quite strong. But with too little water — or too much — sand is prone to collapse. For those of us outside the construction industry, we’re most likely to run into this problem on the beach while digging holes in the sand. In this Practical Engineering video, Grady explains the forces that stabilize and destabilize piled sand and where the dangers of excavation lie. (Video and image credit: Practical Engineering)
Fediverse Reactions
-

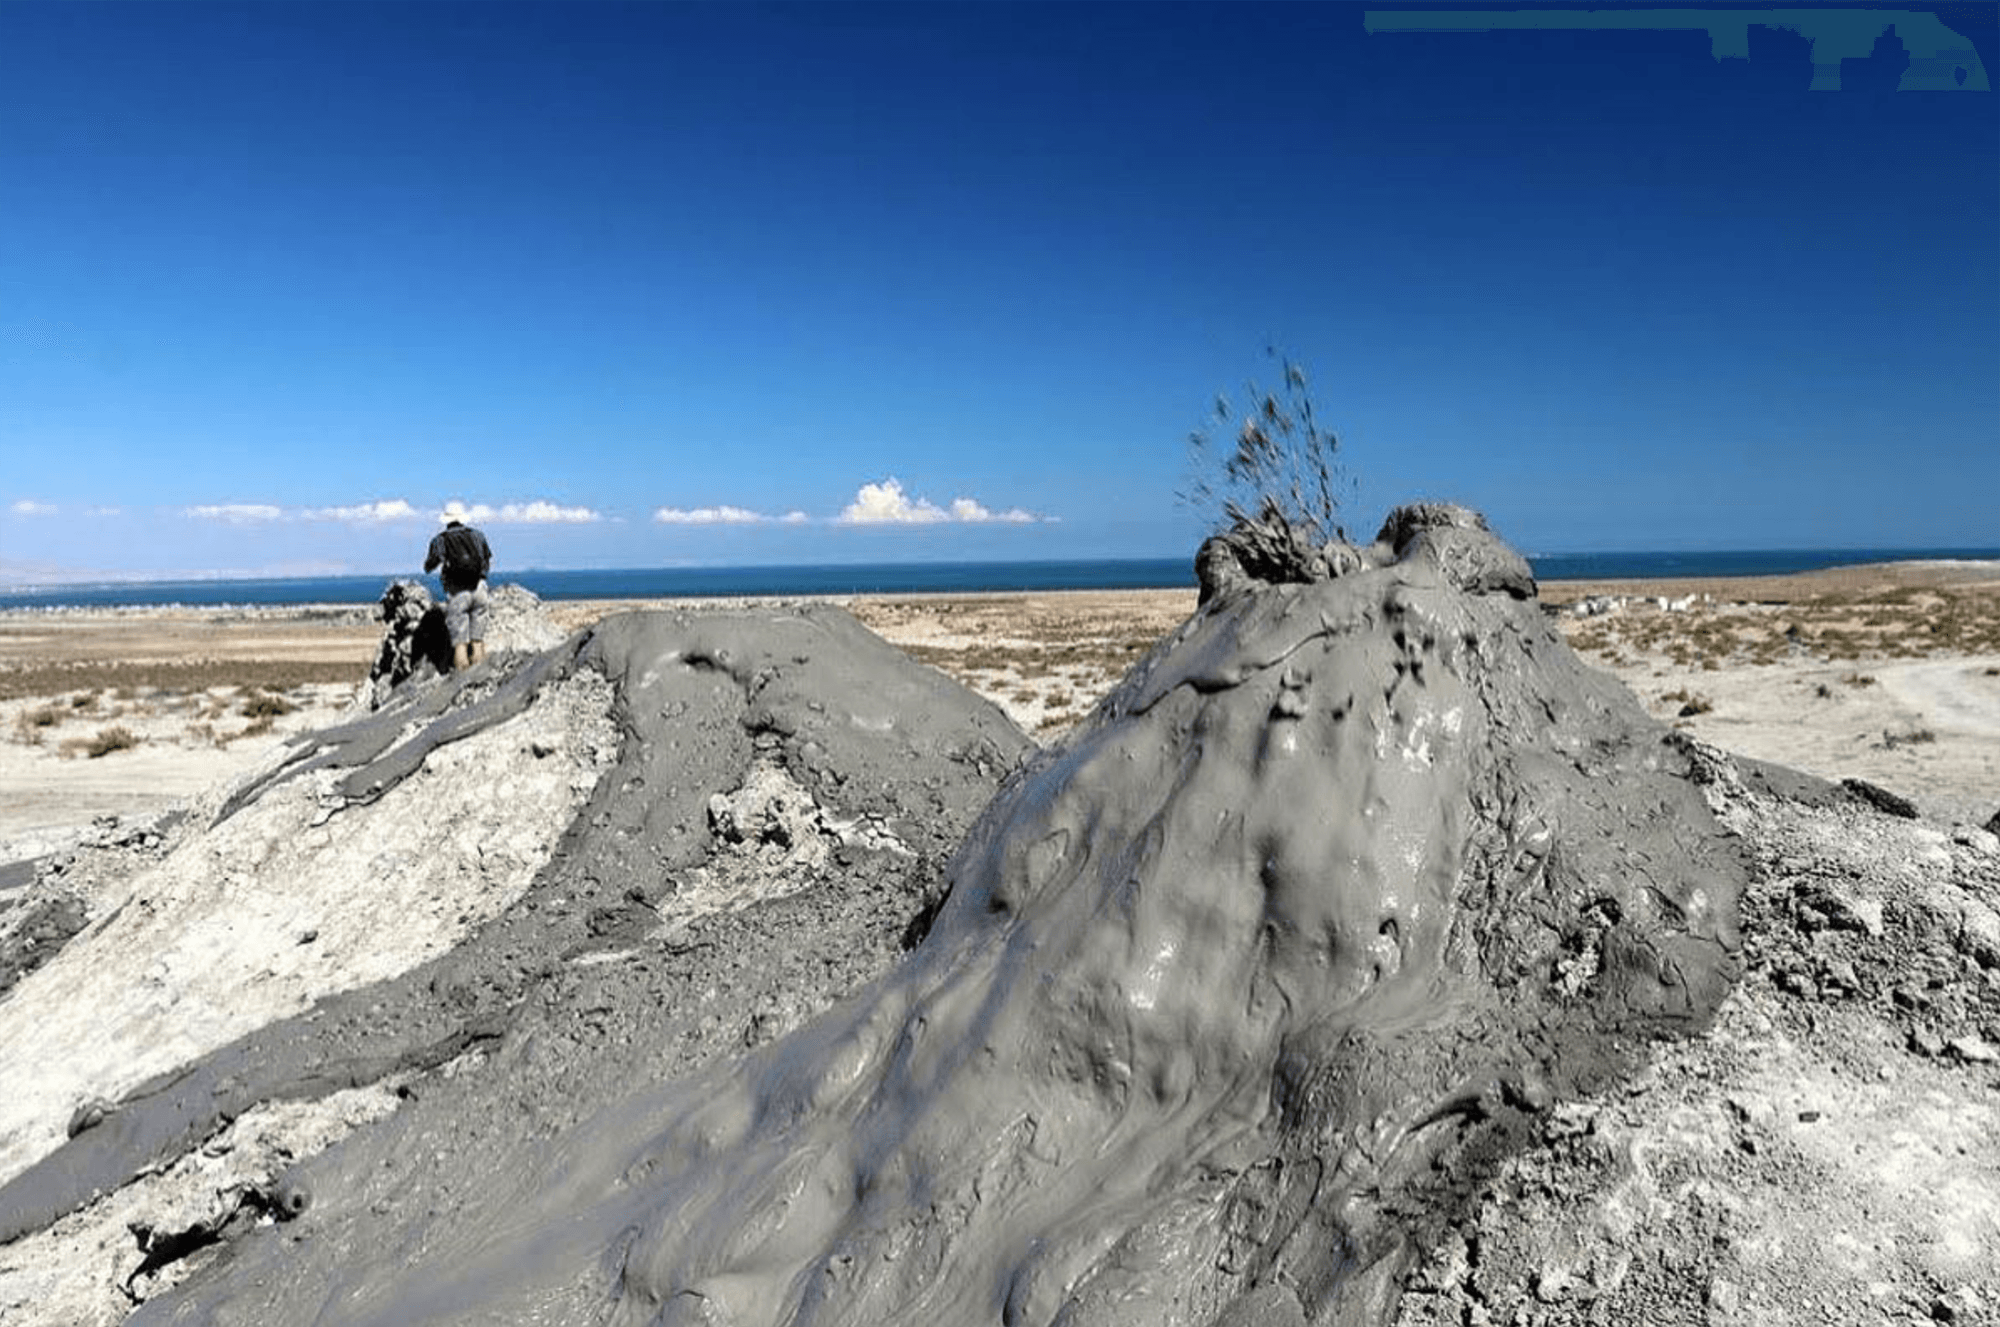
Martian Mud Volcanoes
Mars features mounds that resemble our terrestrial mud volcanoes, suggesting that a similar form of mudflow occurs on Mars. But Mars’ thin atmosphere and frigid temperatures mean that water — a prime ingredient of any mud — is almost always in either solid or gaseous form on the planet. So researchers explored whether salty muds could flow under Martian conditions. They tested a variety of salts, at different concentrations, in a low-pressure chamber calibrated to Mars-like temperatures and pressures. The salts lowered water’s freezing point, allowing the muds to remain fluid. Even a relatively small amount of sodium chloride — 2.5% by weight — allowed muds to flow far. The team also found that the salt content affected the shape the flowing mud took, with flows ranging from narrow, ropey patterns to broad, even sheets. (Image credit: P. Brož/Wikimedia Commons; research credit: O. Krýza et al.; via Eos)
Fediverse Reactions
-

Bifurcating Waterways
Your typical river has a single water basin and drains along a river or two on its way to the sea. But there are a handful of rivers and lakes that don’t obey our usual expectations. Some rivers flow in two directions. Some lakes have multiple outlets, each to a separate water basin. That means that water from a single lake can wind up in two entirely different bodies of water.
The most famous example of these odd waterways is South America’s Casiquiare River, seen running north to south in the image above. This navigable river connects the Orinoco River (flowing east to west in this image) with the Rio Negro (not pictured). Since the Rio Negro eventually joins the Amazon, the Casiquiare River’s meandering, nearly-flat course connects the continent’s two largest basins: the Orinoco and the Amazon.
For more strange waterways across the Americas, check out this review paper, which describes a total of 9 such hydrological head-scratchers. (Image credit: Coordenação-Geral de Observação da Terra/INPE; research credit: R. Sowby and A. Siegel; via Eos)
Fediverse Reactions
-

Arctic Melt
Temperatures in the Arctic are rising faster than elsewhere, triggering more and more melting. Photographer Scott Portelli captured a melting ice shelf protruding into the ocean in this aerial image. Across the top of the frozen landscape, streams and rivers cut through the ice, leading to waterfalls that flood the nearby ocean with freshwater. This meltwater will do more than raise ocean levels; it changes temperature and salinity in these regions, disrupting the convection that keeps our planet healthy. (Image credit: S. Portelli/OPOTY; via Colossal)
Fediverse Reactions
-

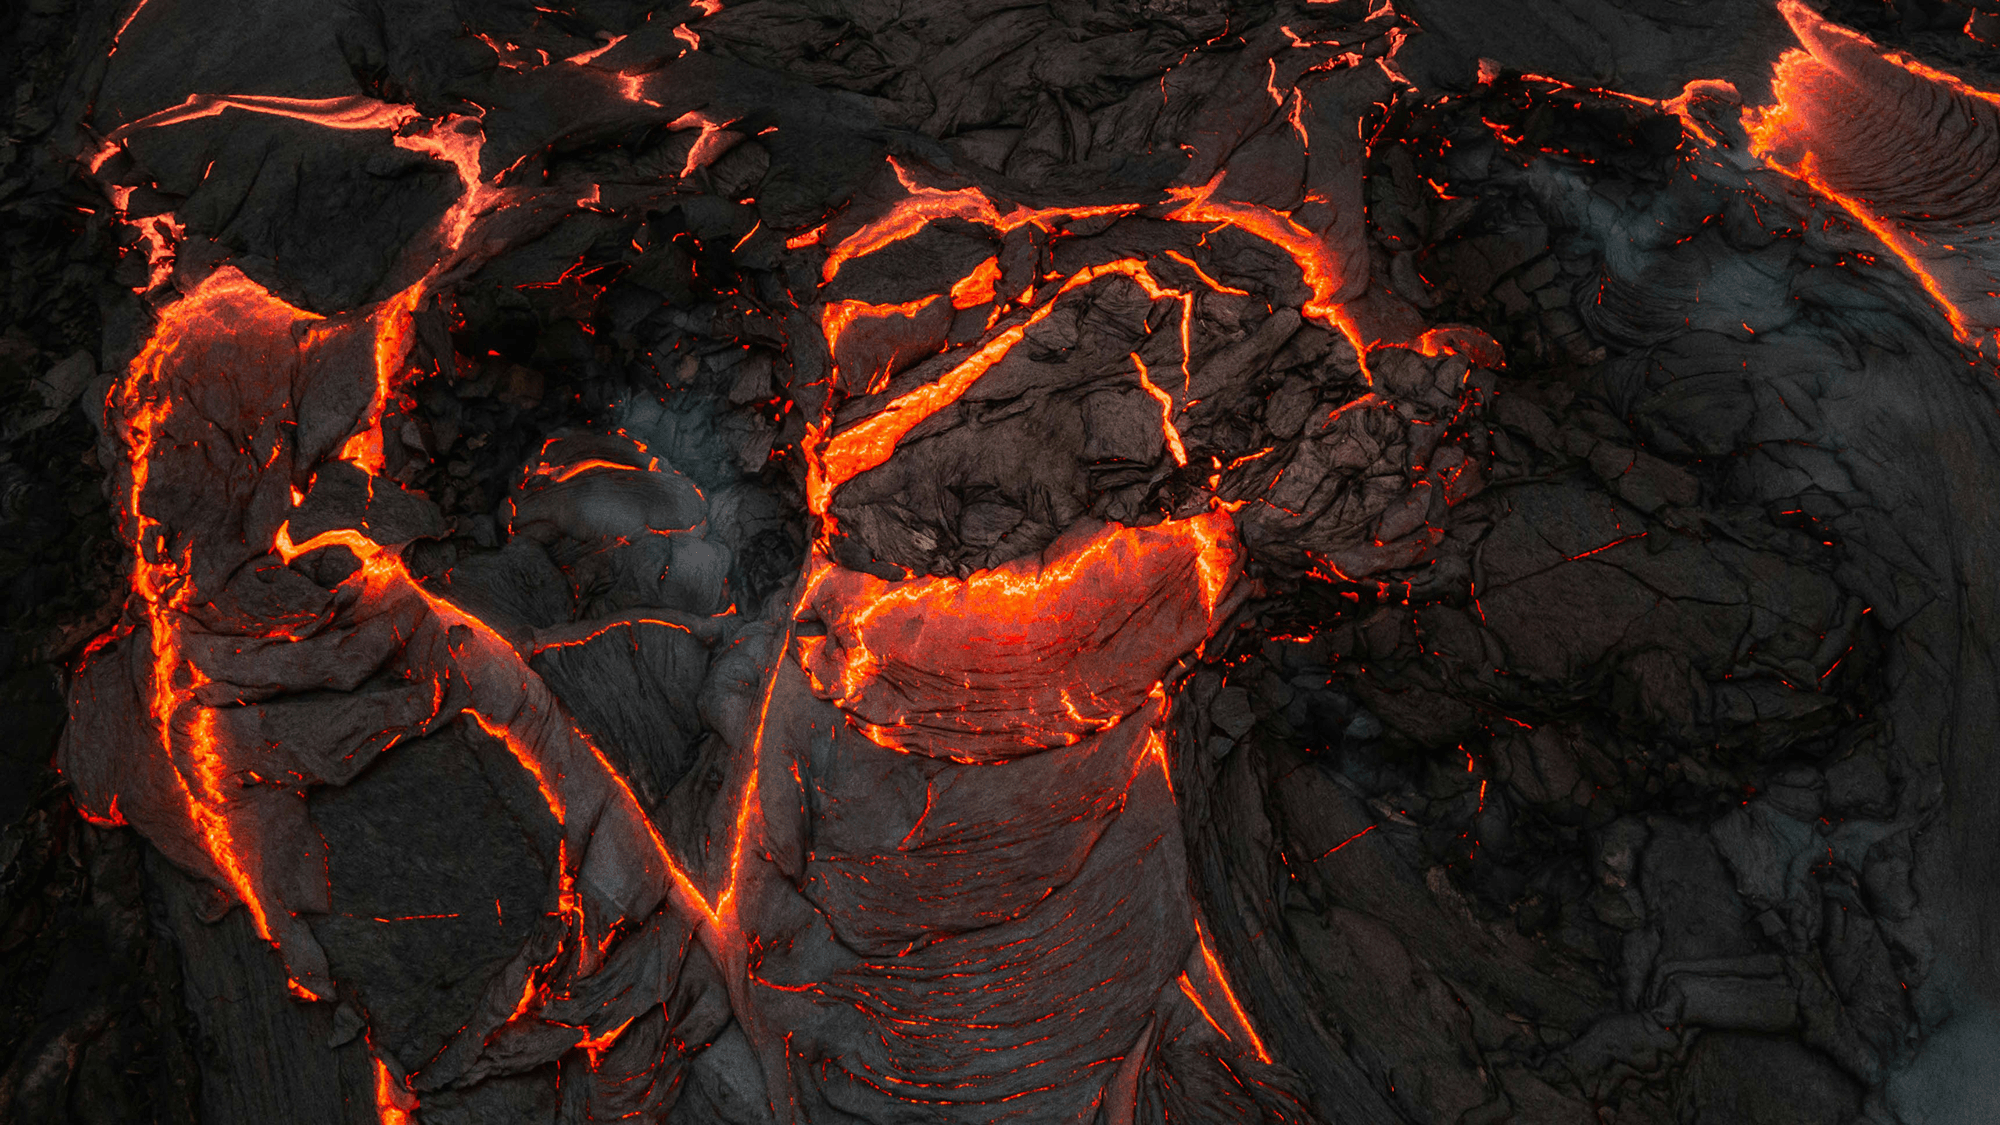
Reclaiming the Land
Lava floods human-made infrastructure on Iceland’s Reykjanes peninsula in this aerial image from photographer Ael Kermarec. Protecting roads and buildings from lava flows is a formidable challenge, but it’s one that researchers are tackling. But the larger and faster the lava flow, the harder infrastructure is to protect. Sometimes our best efforts are simply overwhelmed by nature’s power. (Image credit: A. Kermarec/WNPA; via Colossal)
Fediverse Reactions
-

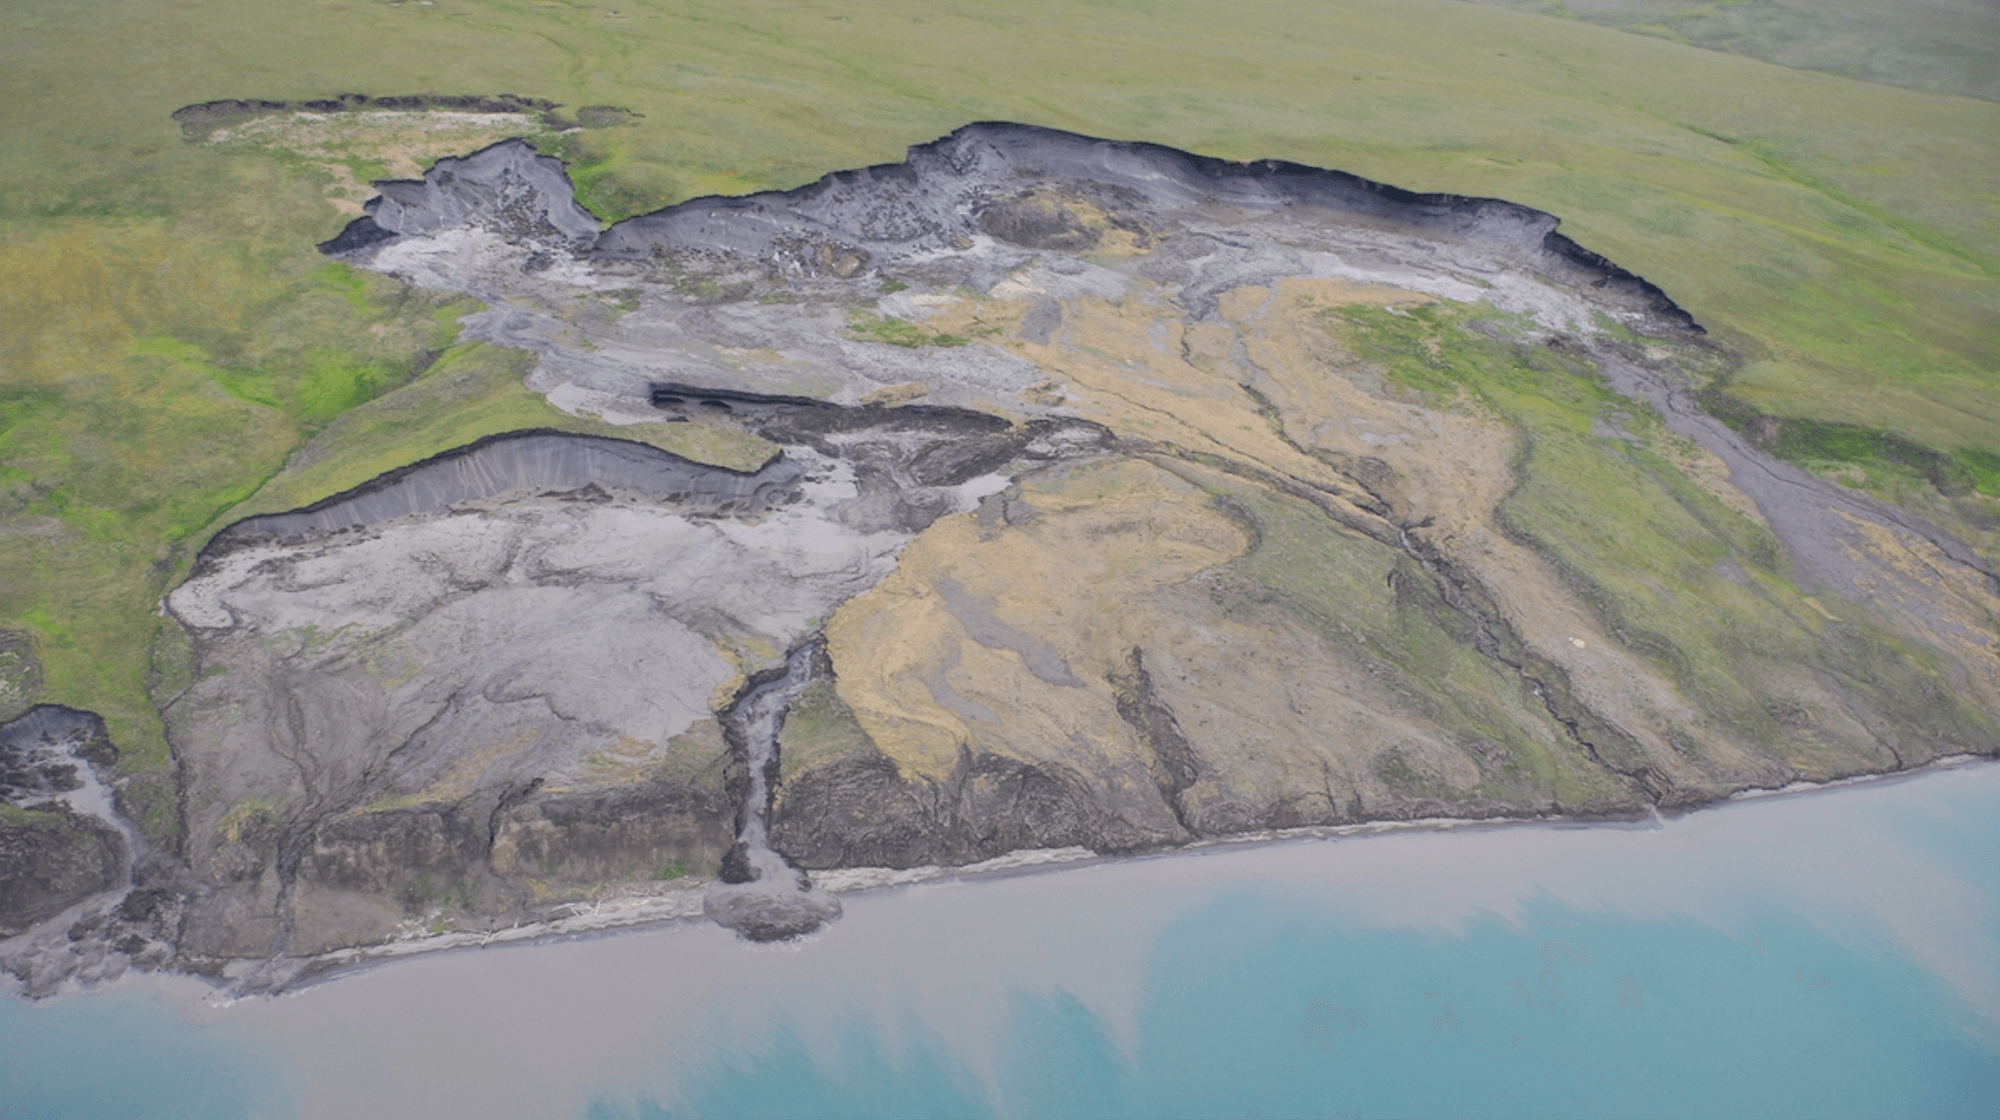
Thawing Permafrost Primes Slumps
As permafrost thaws on Arctic hillsides and shorelines, the land often deforms in a unique fashion, known as a slump. Formally known as mega retrogressive thaw slumps, these areas superficially resemble a landslide. They’re also prone to repeat performances: as many as 90% of Canada’s Arctic slumps recur in the same place as previous slumps. Researchers used ground-penetrating radar and other tools to study the underground structure at slumps and found that several factors contribute to this repetitive cycle.
Seawater soaking into the foot of a hilly shore can destabilize the permafrost, creating a slump. That changes the nearby ground cover, exposing more permafrost to warming; their measurements showed this warming could extend tens of meters underground, priming the area for future slumps. Similarly, the mudslides and narrow ravines that form on an active slump also shift away ground cover and warm the underlying permafrost. Together, these factors suggest that once a slump forms, more slumps will occur as the underlying permafrost warms. (Image credit: M. Krautblatter; research credit: M. Krautblatter et al.; via Eos)
Fediverse Reactions
-

“Visions in Ice”
The glittering blue interior of an ice cave sparkles in this award-winning image by photographer Yasmin Namini. The cave is underneath Iceland’s Vatnajokull Glacier. Notice the deep scallops carved into the lower wall. This shape is common in melting and dissolution processes. It is unavoidable for flat surfaces exposed to a melting/dissolving flow. (Image credit: Y. Namini/WNPA; via Colossal)
Fediverse Reactions
-

Slipping Ice Streams
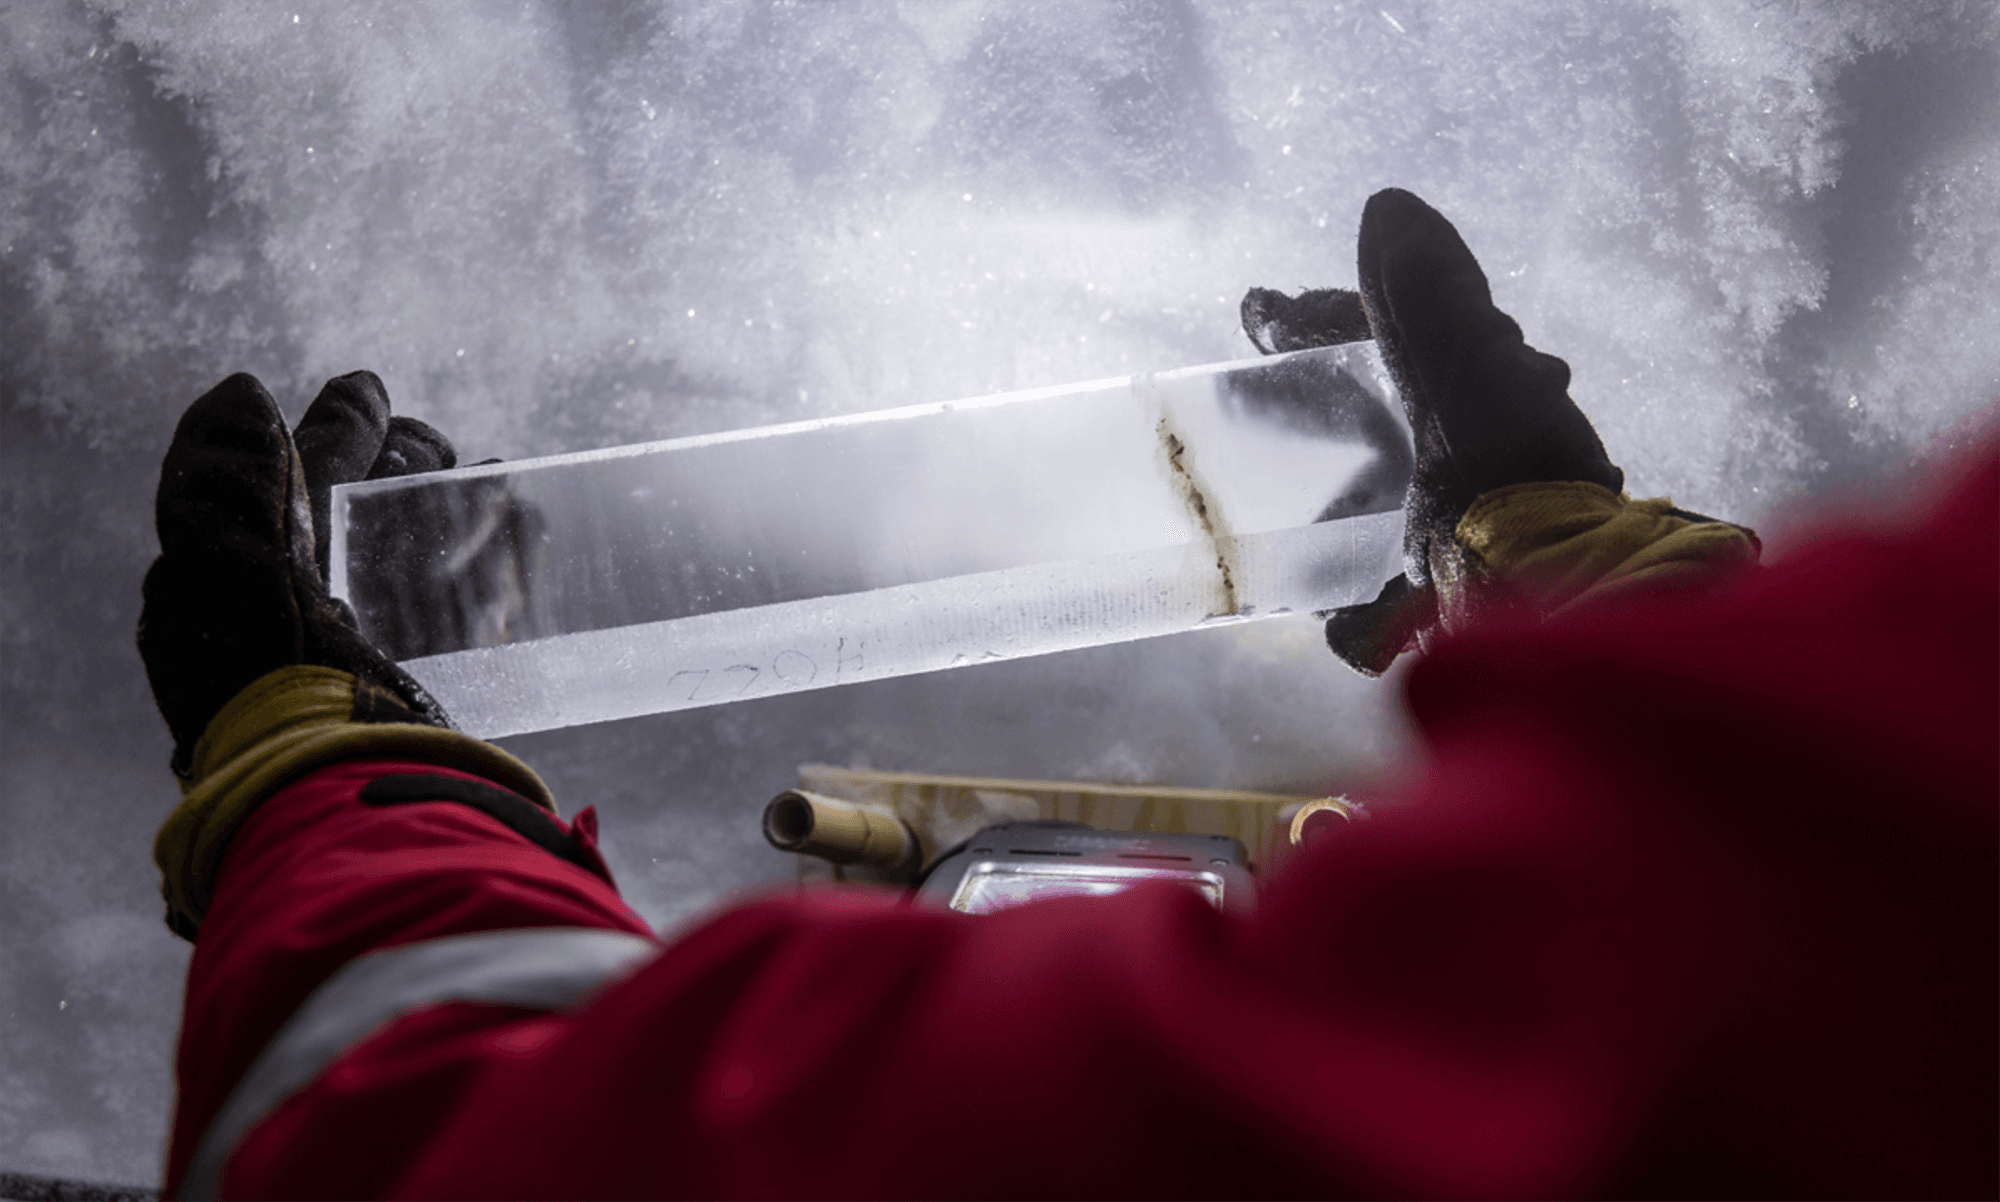
The Northeast Greenland Ice Stream provides about 12% of the island’s annual ice discharge, and so far, models cannot accurately capture just how quickly the ice moves. Researchers deployed a fiber-optic cable into a borehole and set explosive charges on the ice to capture images of its interior through seismology. But in the process, they measured seismic events that didn’t correspond to the team’s charges.
Instead, the researchers identified the signals as small, cascading icequakes that were undetectable from the surface. The quakes were signs of ice locally sticking and slipping — a failure mode that current models don’t capture. Moreover, the team was able to isolate each event to distinct layers of the ice, all of which corresponded to ice strata affected by volcanic ash (note the dark streak in the ice core image above). Whenever a volcanic eruption spread ash on the ice, it created a weaker layer. Even after hundreds more meters of ice have formed atop these weaker layers, the ice still breaks first in those layers, which may account for the ice stream’s higher-than-predicted flow. (Image credit: L. Warzecha/LWimages; research credit: A. Fichtner et al.; via Eos)
Fediverse Reactions
-


.JPG)