One of the great challenges in fluid dynamics is understanding how order gives way to chaos. Initially smooth and laminar flows often become disordered and turbulent. This video explores that transition in a new way using sound. Here’s what’s going on.

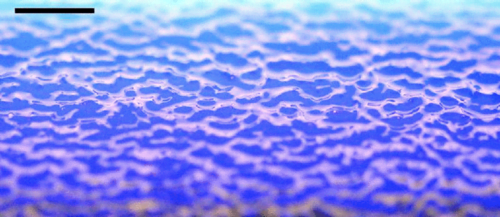
The first segment of the video shows a flat surface covered in small particles that can be moved by the flow. Initially, that flow is moving in right to left, then it reverses directions. The main flow continues switching back and forth in direction. This reversal tends to provoke unstable behaviors, like the Tollmien-Schlichting waves called out at 0:53. Typically, these perturbations in the flow start out extremely small and are difficult or even impossible to see by eye. So researchers take photos of the particles you see here and analyze them digitally. In particular, they are looking for subtle patterns in the flow, like a tendency for particles to clump together with a consistent spacing, or wavelength, between them. Normally, researchers would study these patterns using graphs known as spectra, but that’s where this video does something different.
Instead of representing these subtle patterns graphically, the researchers transformed those spectra into sound. They mapped the visual data to four octaves of C-major, which means that you can now hear the turbulence. When the audio track shifts from a pure note to an unsteady warble, you’re hearing the subtle disturbances in the flow, even when they’re too small for your eye to pick out.
The last part of the video takes this technique and applies it to another flow. We again see a flat plate, but now it has a roughness element, like a tiny hockey puck, stuck to it. As the flow starts, we see and hear vortices form behind the roughness. Then a horseshoe-shaped vortex forms upstream of it. Aside from the area right around the roughness, this flow is still laminar. But then turbulence spreads from upstream, its fingers stretching left until it envelops the roughness element and its wake, making the music waver. (Video and image credit: P. Branson et al.)