Tag: flow visualization

  • To Fizz or Not to Fizz

    To Fizz or Not to Fizz

    Place a drop of carbonated water on a superhydrophobic surface and it will slide almost frictionlessly, much the way Leidenfrost drops do. The drop behaves this way thanks to the self-produced layer of carbon dioxide vapor that it levitates on. As the gas escapes, the drop eventually settles back into contact with its surface. But until then, its levitation makes for some fun.

    On the treated half of the glass (left), bubbles form a continuous film against the glass. On the untreated side (right), bubbles nucleate, grow, and rise as expected for a fizzy drink.
    On the treated half of the glass (left), bubbles form a continuous film against the glass. On the untreated side (right), bubbles nucleate, grow, and rise as expected for a fizzy drink.

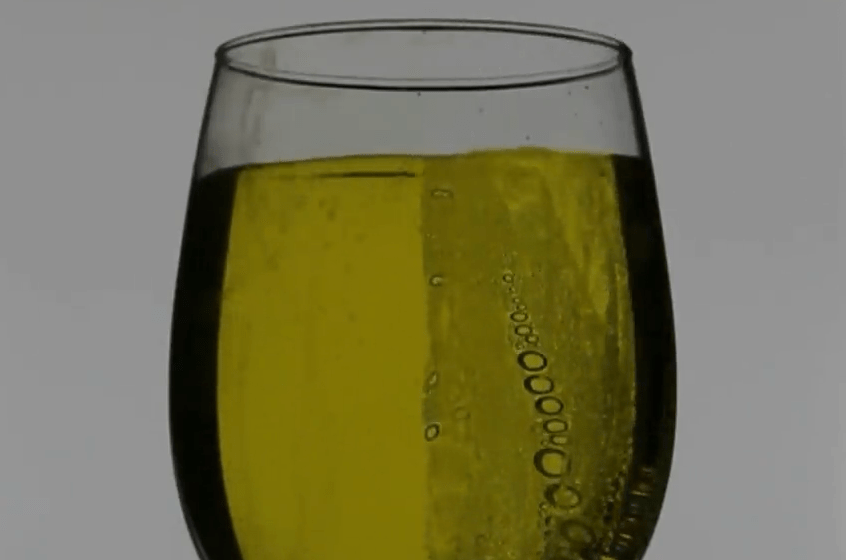
    Single droplets aren’t the only source of fun, however. In the images above, researchers coated the left half of a wine glass with a superhydrophobic treatment, while leaving the right half of the glass untouched. Once (dyed) carbonated water is poured into the glass, we see a bizarre dichotomy. In the right, untreated half of the glass, carbon dioxide bubbles nucleate, grow, and rise through the glass. But on the left side, the liquid appears still and bubble-less. In fact, the carbon dioxide gas on the left side is forming a continuous bubble film by the surface of the glass! (Image, video, and research credit: P. Bourrianne et al., see also)

  • Featured Video Play Icon

    Snowing in the Core

    Some rocky planetary bodies, like Jupiter‘s moon Ganymede, generate magnetic fields through snow-like, solid precipitation that falls in their liquid metal cores. To study this peculiar and complex arrangement, researchers look at sugar grains falling through — and dissolving into — water. The solid sugar grains mimic the iron snowflakes that fall in Ganymede’s core. As they sink, they drag fluid with them. But the grains can also dissolve, making the fluid around them denser and prone to sinking even faster. The dense, sinking flows trigger buoyant convection inside the surrounding fluid.

    As seen in the experiments, there are many factors competing here. Large grains dissolve more slowly and are able to drag more fluid with them as they fall. Small grains, on the other hand, dissolve quickly, causing more buoyancy-driven flows. Laboratory analogs like these help scientists unravel the complexities of situations we cannot observe otherwise. (Image and video credit: Q. Kriaa et al.)

  • Featured Video Play Icon

    Self-Propelled Droplets

    Drops of ethanol on a heated surface contract and self-propel as they evaporate. My first thought upon seeing this was of Leidenfrost drops, but the surface is not nearly hot enough for that effect. Instead, it’s significantly below ethanol’s boiling point. Looking at the drops in infrared reveals beautiful, shifting patterns of convection cells on the drop. The patterns are driven by the temperature difference along the drop; at the bottom, the drop is warmest, and at its apex, it is coldest. Those differences in temperature create differences in surface tension, which drives a surface flow that breaks the drop’s symmetry. The asymmetry, the authors suggest, is responsible for the drop’s propulsion. (Image and video credit: N. Kim et al.)

  • Featured Video Play Icon

    “A Sense of Scale – Reminiscence”

    In so much of fluid dynamics, size does not matter. We see the same patterns mirrored across nature from a fuel injection nozzle to galactic clusters. And no one plays with that sense of scale better than artist Roman De Giuli, whose microscale practical effects give the impression of flying above glittering alien coastlines. Ink and paint squeeze around craggy islands, leaving perfect streamlines to mark their passage. Fractal fingers expand like river deltas seeking the path to the sea. Enjoy more of De Giuli’s work on his website and Instagram. (Image and video credit: R. De Giuli; via Colossal)

  • Featured Video Play Icon

    Draining a Bottle

    Turn a bottle upside-down to empty it, and you’ll hear a loud glug-glug-glug as the liquid in the bottle empties and air rushes in. In this video, researchers aim a high-speed camera at the very first bubble that forms during the process. Once the bubble reaches the wider area of the bottle, it tends to pinch off in the bottle’s neck. That creates a narrow jet that pierces the bubble and flies all the way to the other side, leaving a column of liquid inside the rising bubble. Increasing the fluid’s viscosity has remarkably little effect, at least until the liquid is extremely viscous. (Image and video credit: H. Mayer et al.)

  • Waves in Liquid Crystals

    Waves in Liquid Crystals

    Liquid crystals are now ubiquitous in displays, but scientists are still discovering new properties for this state of matter. Here, a team explores nematic liquid crystals, whose rod-like shape rotates in three dimensions as they apply a voltage. The layer of liquid crystals is held between polarizing filters, creating regions of light and dark that depend on the liquid crystals’ orientations.

    Traveling waves and other wave patterns form in this liquid crystal as the voltage applied to it increases.
    Traveling waves and other wave patterns form in this liquid crystal as the voltage applied to it increases.

    As the researchers increase the voltage, traveling waves form. With higher voltages, the waves appear to slow a stop. The slowing waves result from the molecules tilting far from a vertical orientation, which makes it harder for individual molecules to rotate since they experience greater resistance from their neighbors. (Image, video, and research credit: V. Panov et al.; via APS Physics)

  • Featured Video Play Icon

    Classifying Waves

    In a lab, researchers create their waves in a long, clear-sided tank, where they can observe how the waves form, travel, and interact. To generate the wave, they use a plate, attached to a piston. Push the water at one end, and a wave forms. The type of wave that forms depends on both the velocity and the stroke length of the piston, as shown in this video. By mapping out these two variables, researchers can observe all different sorts of waves, from peaceful solitary waves to wild, plunging breakers. (Image and video credit: W. Sarlin et al.)

  • Airflow in the Opera

    Airflow in the Opera

    Like so many other performers, the singers and musicians of New York’s Metropolitan Opera House were left without a way to safely perform when the SARS-CoV-2 pandemic began in early 2020. In search of safe ways to perform and rehearse, the Met turned to researchers at nearby Princeton University, who worked directly with the performers to explore aerosol production and airflow in the context of professional opera.

    Through visualization and other experiments, the team found that the highly-controlled breathing of opera singers actually posed a lower risk for spreading pathogens than typical speaking and breathing. Most of a singer’s voiced sounds are sustained vowels, which produce a slow, buoyant jet that remains close to a singer. The exception are consonants, which created rapid, forward-projected jets.

    In the orchestra, the researchers found that placing a mask over the bell of wind instruments like the trombone reduced the speed and spread of air. One of the highest risk instruments they found was the oboe. Playing the oboe requires a long, slow release of air, but between musical phrases, oboists rapidly exhale any remaining air from their lungs and take a fresh breath. That rapid exhale creates a fast, forceful jet of air that necessitates placing the oboist further from others. (Image credit: top – P. Chiabrando, others – P. Bourrianne et al.; research credit: P. Bourrianne et al.; via APS Physics; submitted by Kam-Yung Soh)

  • Featured Video Play Icon

    Walking in the Wake

    Flow visualization is an important tool in fluid dynamics, and scientists have many ways to capture and visualize flow information. But our methods are not the only — or even the best — ways to express a flow. Here, engineers teamed up with architects and artists to explore the flow behind an oscillating cylinder. When free to move forward-and-backward the cylinder’s wake takes on three distinctively forms. The team explored many ways to display the wakes — drawings, 3D-printed sculptures, and more — before ultimately building an art installation that lets visitors walk through the wake to experience it. I love the creativity of these interdisciplinary efforts. To see a similar, yet very different, take on the wake of a cylinder, check out this interpretative dance. (Image and video credit: P. Boersma et al.)

  • Why Moths Are Slow Fliers

    Why Moths Are Slow Fliers

    Hawkmoths and other insects are slow fliers compared to birds, even ones that can hover. To understand why these insects top out at 5 m/s, researchers simulated their flight from hovering to forward flight at 4 m/s. They analyzed real hawkmoths flying in wind tunnels to build their simulated insects, then studied their digital moths with computational fluid dynamics.

    During hovering flight, they found that hawkmoths generate equal amounts of lift with their upstroke and downstroke. As the moth transitions into forward flight, though, its wing orientation shifts to reduce drag, and the upstroke stops being so helpful. Instead, the upstroke generates a downward lift that the downstroke has to counter in addition to the insect’s weight. At higher forward speeds, this trend gets even worse.

    The final verdict? Hawkmoths don’t have the flexibility to twist their wings on the upstroke the way birds do to avoid that large downward lift. Since they can’t mitigate that negative lift, the insects have a slower top speed overall. (Image and research credit: S. Lionetti et al.; via APS Physics; submitted by Kam-Yung Soh)