In addition to looking outward, NASA constantly monitors our own planet using a suite of satellites. In this video, they visualize data taken by the Global Precipitation Measurement Core Observatory of Hurricane Maria two days before it hit Puerto Rico. Instruments on board the satellite measure both liquid and frozen precipitation, giving scientists – and now the public – a glimpse into the heart of a developing hurricane. Be sure to take a look around; it’s a 360-degree video, and I bet it’s even more spectacular in VR. Having a trove of data like this helps researchers better understand the processes that influence a strengthening hurricane, which ultimately allows them to make better predictions about hurricane behavior in order to save lives. (Video credit: NASA; via Francesco C.)
Search results for: “flow visualization”

Swirls of Color
These beautiful swirls show the wake downstream of a thin plate. Here water is flowing from left to right and dye introduced on the plate (upstream and unseen in the photo) curls up into vortices. The vortices in the top row rotate clockwise, while the vortices along the bottom rotate anti-clockwise. This pattern of alternating vortices is extremely common in the wakes of objects and is known as a von Karman vortex street. Similar patterns are seen in soap films, behind cylinders, in the wakes of islands, and behind spaceships. (Image credit: ONERA, archived here)

From Firenado to Water Spout
Just a few years ago, fire tornadoes were almost fabled because they were so rarely captured on video. Now, with worsening wildfire seasons and cell phone cameras everywhere, there are new videos all the time. This video captures a fire tornado that sets off a water spout as it reaches the river (~1:15 in).
Neither the fire tornado or the water spout is truly tornadic; instead they are more like dust devils. They are driven by the rising heat of the fire. As cooler, ambient air flows inward to replace the rising air, it brings with it any vorticity it had. And, like an ice skater, the incoming air spins faster as it moves inward. This sets up both the fire tornado and the water spout’s vortices.
Although this is the first example I’ve seen video of, fire tornadoes have been known to create water spouts before. Lava flowing into the ocean can create whole trains of them. (Video credit: C. & A. Mackie; via Jean H.)
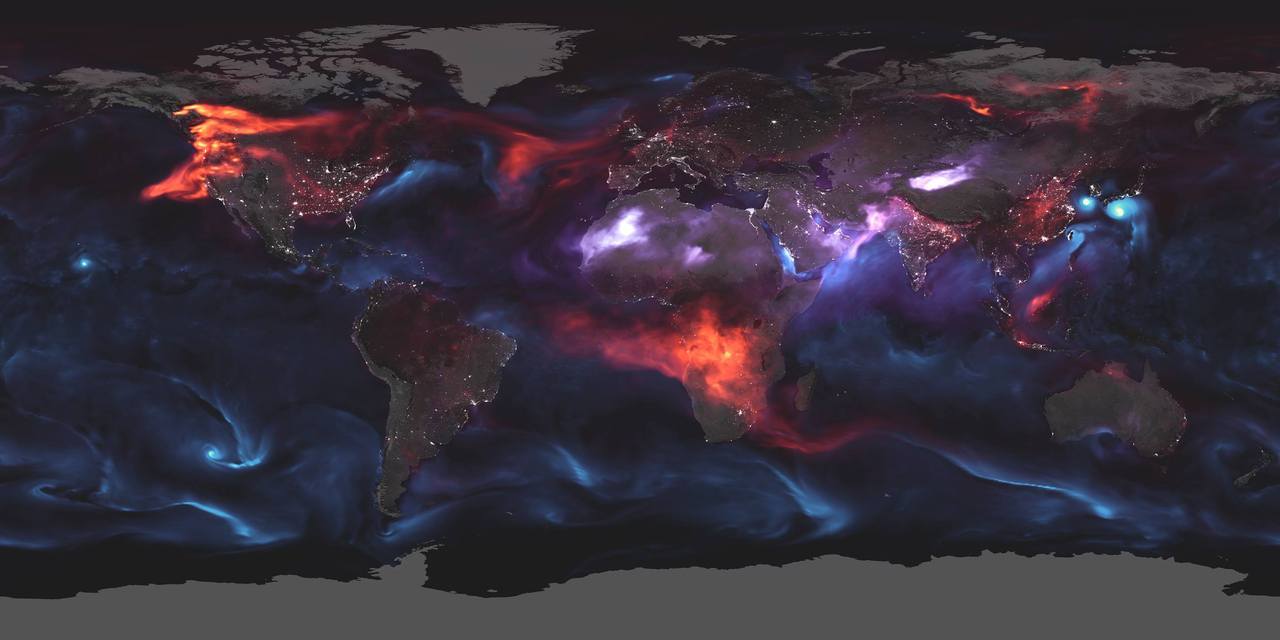
Visualizing Aerosols
Aerosols, micron-sized particles suspended in the atmosphere, impact our weather and air quality. This visualization shows several varieties of aerosol as measured August 23rd, 2018 by satellite. The blue streaks are sea salt suspended in the air; the brightest highlights show three tropical cyclones in the Pacific. Purple marks dust. Strong winds across the Sahara Desert send large plumes of dust wafting eastward. Finally, the red areas show black carbon emissions. Raging wildfires across western North America are releasing large amounts of carbon, but vehicle and factory emissions are also significant sources. (Image credit: NASA; via Katherine G.)
The Sensitivity of a Seal’s Whiskers
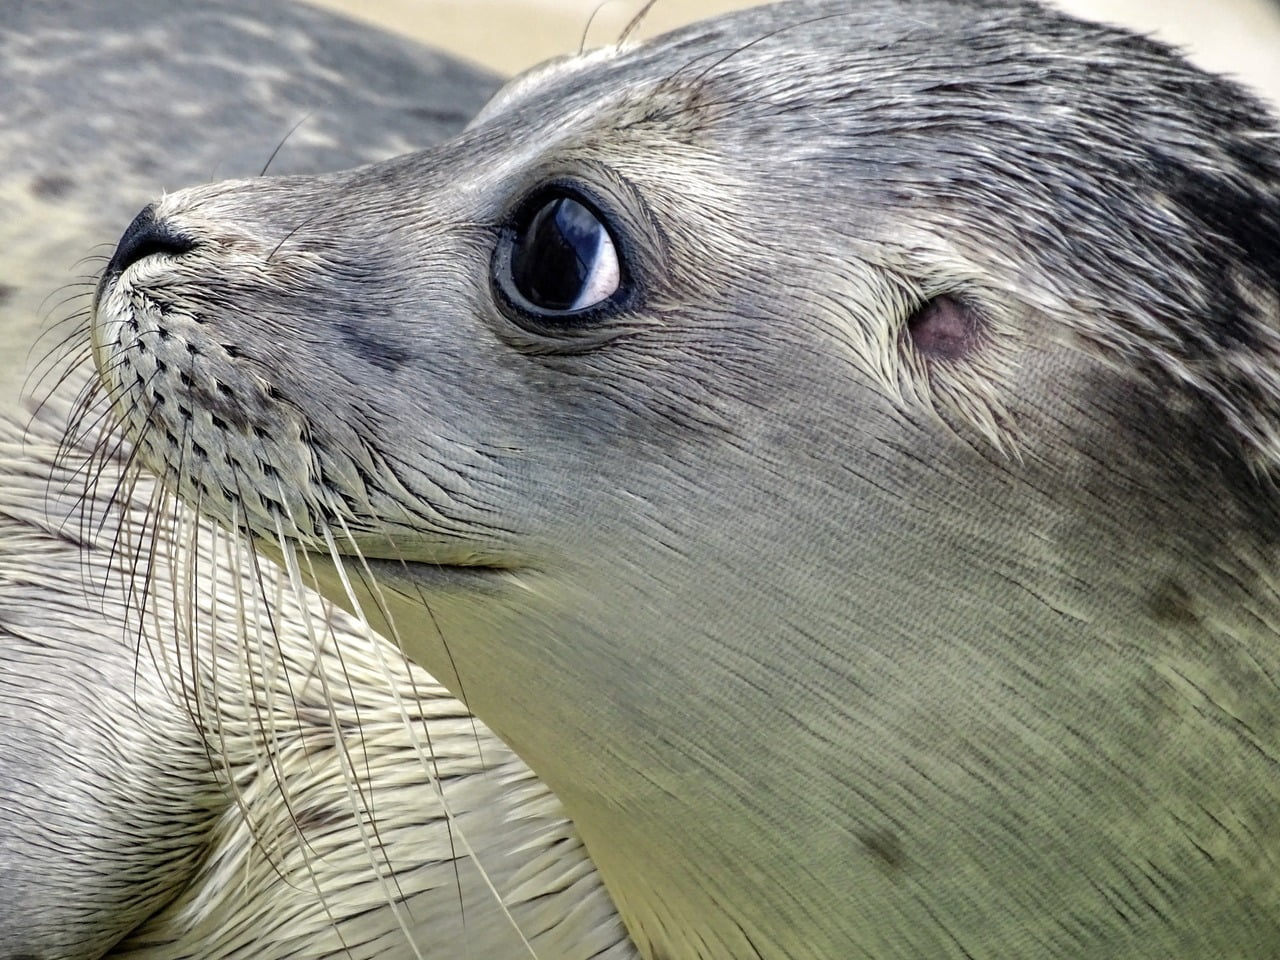
Harbor seals and their brethren have a superpower that lets them track their prey even without sight or sound. It’s their whiskers, which are sensitive enough to follow the trail left by a single fish thirty seconds earlier. The secret to the whisker’s sensitivity lies in its shape. Instead of a uniform, circular cross-section, the seal’s whisker is oval-shaped and its width varies along the length in a wavy pattern. So unlike a straight cylinder, which vibrates when towed through water, the seal’s whiskers are unperturbed by their own movement. They shed only weak vortices and do not vibrate as a result.
But, if you expose the whiskers to any external turbulence, like the vortices trailing a fish, the whisker ‘slaloms’ back-and-forth in time with the wake. That motion gets transmitted to the nerves in the seal’s cheek, carrying potential information about both the size and speed of the wake’s originator. Researchers hope similar bio-inspired whiskers could help underwater vehicles track schools of fish or locate underwater drilling leaks. (Image credit: M. Richter; video credit: MIT; research credit: H. Beem and M. Triantafyllou; via the Economist; submitted by Russ A. and Kam-Yung Soh)
Pyrocumulus on the Horizon
The Cranston wildfire in California is intense enough that it’s creating its own weather. This timelapse video shows the formation and growth of a pyrocumulus cloud, also associated with volcanoes, over the wildfire. In both instances, the extreme heat causes a massive column of hot, turbulent air to rise. Because ash and smoke are carried upward as well, there are many places for any moisture in the atmosphere to nucleate, forming the cloud we see. In timelapse, the roiling nature of the air’s motion is especially apparent. This turbulence can be dangerous, as it may contribute to high winds and even lightning, both of which can spread the fire further. (Video credit: J. Morris; via James H.)
The Coexistence of Order and Chaos
One of the great challenges in fluid dynamics is understanding how order gives way to chaos. Initially smooth and laminar flows often become disordered and turbulent. This video explores that transition in a new way using sound. Here’s what’s going on.

The first segment of the video shows a flat surface covered in small particles that can be moved by the flow. Initially, that flow is moving in right to left, then it reverses directions. The main flow continues switching back and forth in direction. This reversal tends to provoke unstable behaviors, like the Tollmien-Schlichting waves called out at 0:53. Typically, these perturbations in the flow start out extremely small and are difficult or even impossible to see by eye. So researchers take photos of the particles you see here and analyze them digitally. In particular, they are looking for subtle patterns in the flow, like a tendency for particles to clump together with a consistent spacing, or wavelength, between them. Normally, researchers would study these patterns using graphs known as spectra, but that’s where this video does something different.
Instead of representing these subtle patterns graphically, the researchers transformed those spectra into sound. They mapped the visual data to four octaves of C-major, which means that you can now hear the turbulence. When the audio track shifts from a pure note to an unsteady warble, you’re hearing the subtle disturbances in the flow, even when they’re too small for your eye to pick out.
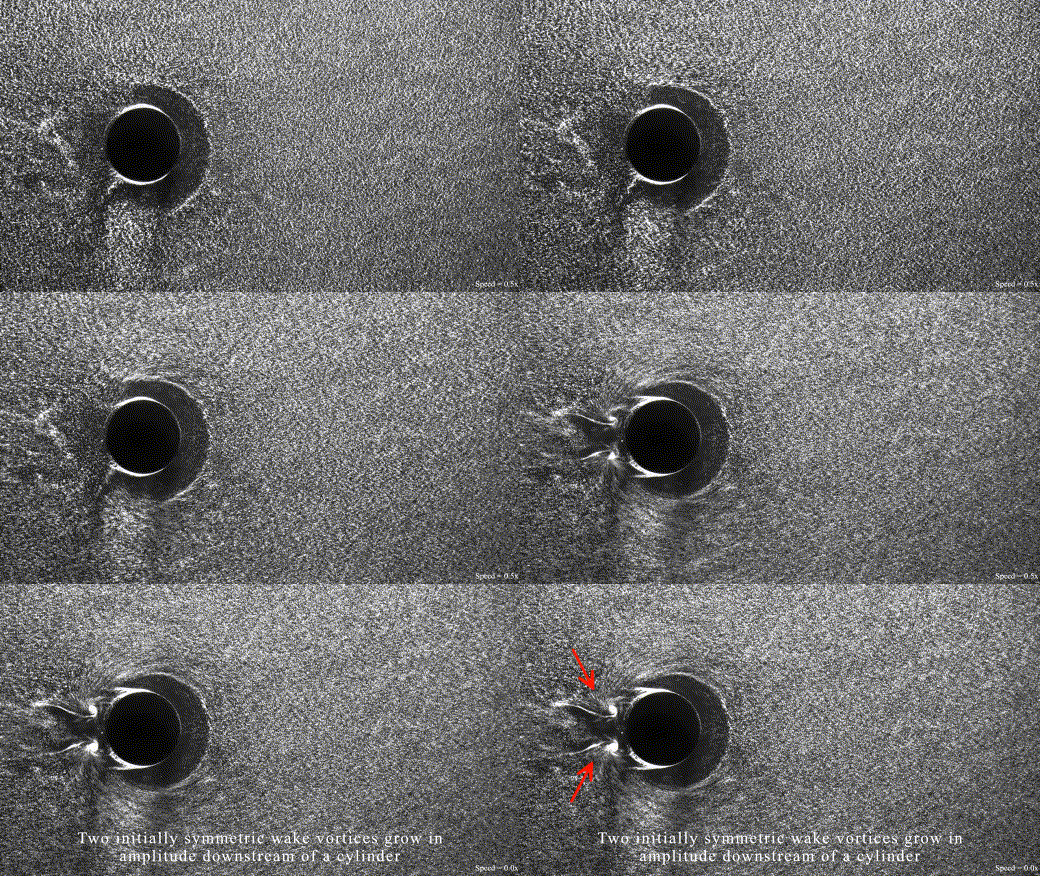
The last part of the video takes this technique and applies it to another flow. We again see a flat plate, but now it has a roughness element, like a tiny hockey puck, stuck to it. As the flow starts, we see and hear vortices form behind the roughness. Then a horseshoe-shaped vortex forms upstream of it. Aside from the area right around the roughness, this flow is still laminar. But then turbulence spreads from upstream, its fingers stretching left until it envelops the roughness element and its wake, making the music waver. (Video and image credit: P. Branson et al.)
Rain on Car Windows

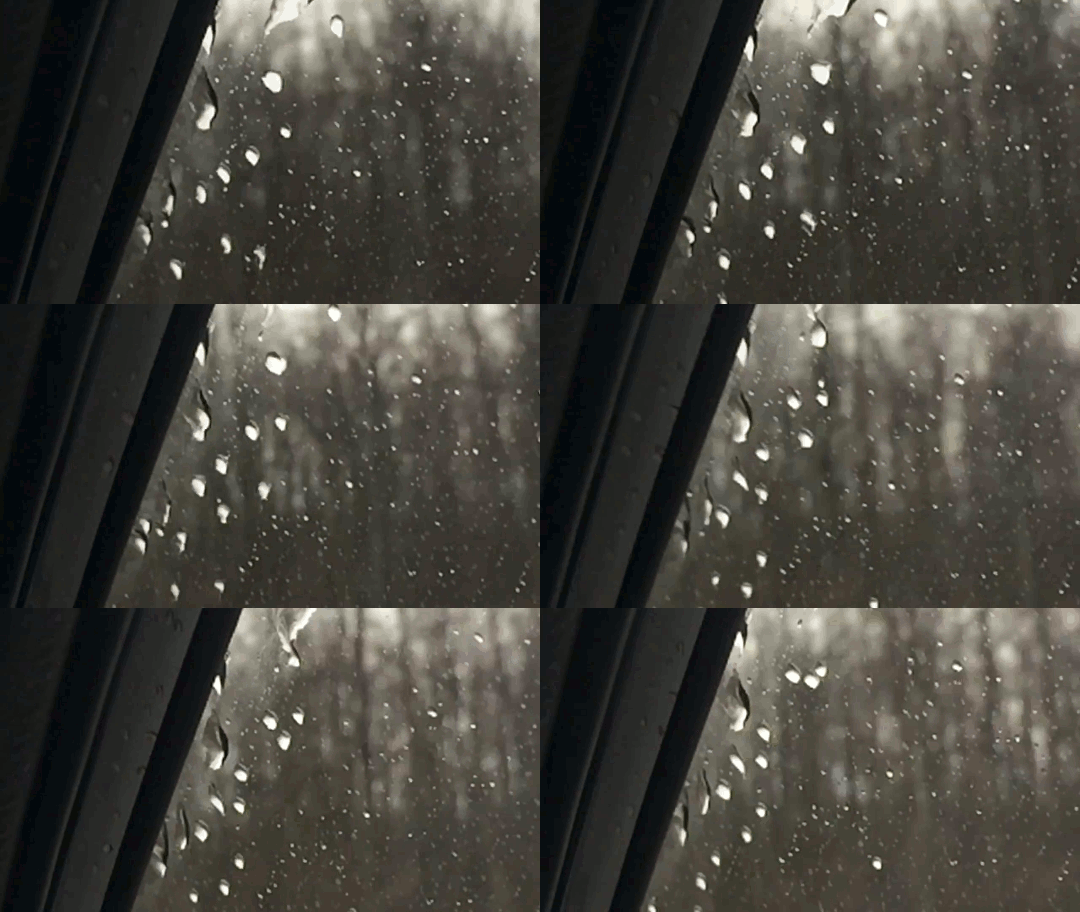
As a child, I loved to ride in the car while it was raining. The raindrops on the window slid around in ways that fascinated and confused me. The idea that the raindrops ran up the window when the car moved made sense if the wind was pushing them, but why didn’t they just fly off instantly? I could not understand why they moved so slowly. I did not know it at the time, but this was my early introduction to boundary layers, the area of flow near a wall. Here, friction is a major force, causing the flow velocity to be zero at the wall and much faster – in this case roughly equal to the car’s speed – just a few millimeters away. This pushes different parts of large droplets unevenly. Notice how the thicker parts of the droplets move faster and more unsteadily than those right on the window. This is because the wind speed felt by the taller parts of the droplet is larger. Gravity and the water’s willingness to stick to the window surface help oppose the push of the wind, but at least with large drops at highway speeds, the wind’s force eventually wins out. (Image credit: A. Davidhazy, source; via Flow Viz)
Caught in a Whirl
Vortex rings may look relatively calm, but they are concentrated regions of intensely spinning flow, as this poor jellyfish demonstrates. The rings form when a high-speed fluid gets pushed suddenly (and briefly) into a slower fluid. In the case of this bubble ring, a burst of air is pushed by a diver into relatively still water. The vorticity caused by the two areas of fluid trying to move past one another forms the ring. Like a spinning ice skater who pulls his arms inward, the narrow core of the vortex spins fast due to the conservation of angular momentum. Meanwhile, the bubble ring moves upward due to its buoyancy, pulling nearby water in as it goes. This catches the hapless jellyfish (who relies on vortex rings itself) and gives it quite a spin. But. don’t worry, the photographer confirmed that the jelly was okay after its ride. (Video credit: V. de Valles; via Ashlyn N.)

Pilot-Wave Hydrodynamics: Faraday Instability
This post is part of a collaborative series with FYP on pilot-wave hydrodynamics. Previous entries: 1) Introduction; 2) Chladni patterns
In 1831, in an appendix to a paper on Chladni plate patterns, physicist Michael Faraday wrote:
“When the upper surface of a plate vibrating so as to produce sound is covered with a layer of water, the water usually presents a beautifully crispated appearance in the neighborhood of the centres of vibration.” #
Faraday was not the first to notice this, as he himself acknowledged, but it was his many clever observations and tests of the phenomenon that led to its naming as the Faraday instability. Like Chladni patterns, Faraday waves can take many forms, depending on the geometry of the vibrator and the frequency and amplitude of its vibration.

Beneath the “crispations” at the air interface, the liquid inside the pool is also moving, driven by the vibrations into streaming patterns. Sprinkling particles into this flow reveals discrete recirculation zones that depend on the vibrations’ characteristics, as seen above. This behavior can even be used to assemble particles into distinct formations.

When the vibrations are large enough at resonant frequencies, the rippling waves at the surface become violent enough to start ejecting droplets. You can experience this for yourself using a Chinese spouting bowl or a Tibetan singing bowl with some water. It’s also, bizarrely enough, a factor in alligator mating behaviors!
Next time, we’ll explore what happens to a droplet atop a Faraday wave.
(Image credits: N. Stanford, source; L. Gledhill, source; The Slow Mo Guys, source)