Two of the most awesome things (in my admittedly biased opinion) about fluid dynamics are the amazing facilities we build for experiments and the tests they allow us to do. In this video, you get a behind-the-scenes look at one such facility, used for wind turbine research at Princeton.
One challenge of wind turbine research is accurately capturing the aerodynamic effects of full-scale wind turbines in the controlled-environment of a laboratory. At Princeton, they match conditions between their model turbines and the real ones by drastically raising the density in their wind tunnel. This means that running the tunnel requires a series of compressors and storage tanks full of compressed air, and it also means that the wind tunnel itself has to be quite hefty to handle the pressure difference inside and out. Definitely check out the full video for more on their wind tunnel and what it can help them learn about wind turbines. (Video credit: M. Miller and J. Keifer; submitted by M. Miller)
All matter is made up of molecules. But most of the time we treat fluids as materials with given properties – like density, viscosity, and surface tension – without worrying about the individual molecules responsible for those material characteristics. Now that we have much more powerful computers, though, we can begin to simulate fluid behavior in terms of molecules.
The animations above show some examples of this. In the top animation, we see a gas condensing into a liquid. As the temperature decreases, molecules start clumping together, and eventually settle into a droplet on the solid surface. The lower animation shows the opposite situation – boiling – in which bubbles of vapor nucleate next to the solid surface and grow as more liquid changes phase. To see more examples, including droplets pinching off, check out the full video. (Image credit: E. Smith et al., source; submitted by O. Matar)
Big animals like whales and sea lions stay warm in cold waters by having thick layers of insulating blubber. But smaller mammals, like beavers and sea otters, have a different mechanism for staying warm – their thick fur traps air near their skin, keeping the cold water at bay. Researchers used flexible, 3D-printed “hairy” surfaces to see how hair density, diving speed, and fluid viscosity affected the amount of air trapped between hairs. This enabled them to build a mathematical model describing the physics, which can now be used to predict, for example, the characteristics needed for a hairy wetsuit that could keep surfers warm in and out of the water. For more on this research check out MIT News’ video, and for a closer look at sea otter fur – not to mention a healthy overdose of pure adorable – check out the video below. (Photo credit: F. Frankel; video credit: Deep Look; research credit: A. Nasto et al.)
Lava flows like these Hawaii’an ones are endlessly mesmerizing. This type of flow is gravity-driven; rather than being pushed by explosive pressure, the lava flows under its own weight and that of the lava upstream. In fact, fluid dynamicists refer to this kind of flow as a gravity current, a term also applied to avalanches, turbidity currents, and cold drafts that sneak under your door in the wintertime. How quickly these viscous flows spread depends on factors like the density and viscosity of the lava and on the volume of lava being released at the vent. As the lava cools, its viscosity increases rapidly, and an outer crust can solidify while molten lava continues to flow beneath. Be sure to check out the full video below for even more gorgeous views of lava. (Image/video credit: J. Tarsen, source; via J. Hertzberg)
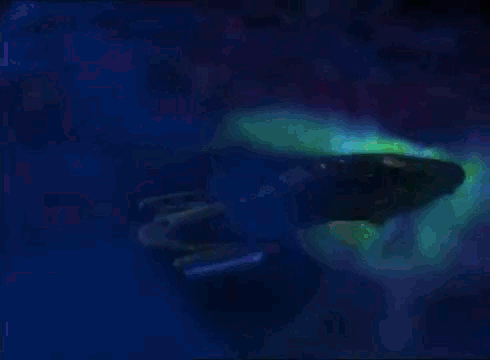
Today’s post is largely brought to you by the fact that I have been sick the past four days and my fiance and I have been bingeing on Star Trek Voyager. At some point, we began wondering about the sequence from 0:30-0:49 in which Voyager flies through a nebula and leaves a wake of von Karman vortices. Would a starship really leave that kind of wake in a nebula?
My first question was whether the nebula could be treated as a continuous fluid instead of a collection of particles. This is part of the continuum assumption that allows physicists to treat fluid properties like density, temperature, and velocity as well-defined quantities at all points. The continuum assumption is acceptable in flows where the Knudsen number is small. The Knudsen number is the ratio of the mean free path length to a characteristic flow length, in this case, Voyager’s size. The mean free path length is the average distance a particle travels before colliding with another particle. Nebulae are much less dense than our atmosphere, so the mean free path length is larger (~ 2 cm by my calculation) but still much smaller than Voyager’s length of 344 m. So it is reasonable to treat the nebula as a fluid.
As long as the nebula is acting like a fluid, it’s not unreasonable to see alternating vortices shed from Voyager. But are the vortices we see realistic relative to Voyager’s size and speed? Physicists use the dimensionless Strouhal number to describe oscillatory flows and vortex shedding. It’s a ratio of the vortex shedding frequency times the characteristic length to the flow’s velocity. We already know Voyager’s size, so we just need an estimate of its velocity and the number of vortices shed per second. I visually estimated these as 500 m/s and 2.5 vortices/second, respectively. That gives a Strouhal number of 0.28, very close to the value of 0.2 typically measured in the wake of a cylinder, the classical case for a von Karman vortex street.
So far Voyager’s wake is looking quite reasonable indeed. But what about its speed relative to the nebula’s speed of sound? If Voyager is moving faster than the local speed of sound, we might still see vortex shedding in the wake, but there would also be a bow shock off the ship’s leading edge. To answer this question, we need to know Voyager’s Mach number, its speed relative to the local speed of sound. After some digging through papers on nebulae, I found an equation to estimate speed of sound in a nebula (Eq 9 of Jin and Sui 2010) using the specific gas constant and temperature. Because nebulae are primarily composed of hydrogen, I approximated the nebula’s gas constant with hydrogen’s value and chose a representative temperature of 500 K (also based on Jin and Sui 2010). This gave a local speed of sound of 940 m/s, and set Voyager’s Mach number at 0.53, inside the subsonic range and well away from any shock wave formation.
Of course, these are all rough estimates and back-of-the-envelope fluid dynamics calculations, but my end conclusion is that Voyager’s vortex shedding wake through the nebula is realistic after all! (Video credit: Paramount; topic also requested by heuste11)
Happy 50th anniversary, Star Trek! Some of my earliest memories of TV are of watching TNG with my parents. Star Trek taught me that curiosity and scientific inquiry were vital and valuable, and that anyone could grow up to be a scientist, engineer, and leader. Thank you for such an inspiring and hopeful vision for humanity’s future!
And, seriously, those von Karman vortices are awesome.
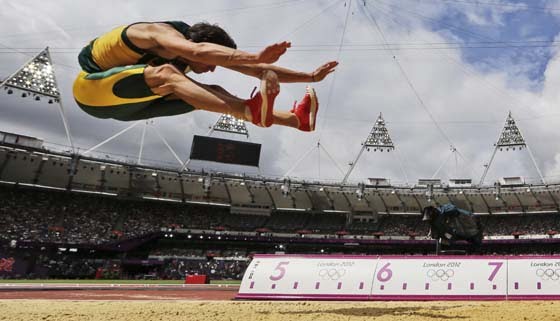
Long jump, like many track and field events, is affected by fluid dynamics in subtle ways. Both wind speed and altitude can modify a jumper’s performance – first, by changing the maximum speed they reach in their sprint, and second, through aerodynamic drag while in flight. Air resistance accounts for roughly 10% of a sprinter’s energy expenditure. A slight tailwind gives an athlete a minor boost in speed that can translate into a more significant increase in jump distance. On the other hand, though, a headwind of the same magnitude has an even stronger negative effect on performance.
The other factor, altitude, comes into play through air density. The official Olympic record for the long jump was set by Bob Beamon in the 1968 Mexico City Games. The high altitude of Mexico City results in an air density that’s only 75% of that at sea level. That’s tougher on athletes in terms of oxygen levels, but it’s a big reduction in the overall drag they face, resulting in both a higher sprinting speed and less aerial drag. This is part of why Beamon’s jump stood as a world record for well over 20 years! (Image credits: AP Photo; AFP/GettyImages; Reuters)
Lots of fluids are transparent, which makes it hard for us to appreciate their motion. One technique for making these invisible motions visible is schlieren photography, which makes differences in density visible. Here it’s combined with high-speed video to show what happens when you use a lighter (minus the spark!). When the fuel starts flowing, it’s unstable and turbulent, but after that initial start-up, you can see the jet settle into a smooth and laminar flow. Wisps of fuel diffuse away from the jet as the fluid disperses. As the valve shuts off, the flow becomes unstable again, and the remains of the lighter fluid diffuse away. (Video credit: The Missing Detail)
Humans have long been fascinated by staring into flames, and the Slow Mo Guys carry on the grand tradition here with 4K, high-speed video of a flamethrower. Like firebreathers, a flamethrower’s fire is the result of a spray of tiny, volatile droplets of fuel. Once ignited, the spray becomes a turbulentjet of flames. Turbulent flows are known for having both large and small-scale structure, and there’s some really great close-ups showing this around the 2:00 mark. Also watch the edges of the flame, where the nearby air has gotten hot enough to shimmer. You can see how the trees in the background ripple and blur as the fire heats up the air and changes its density and refractive index. (Video credit: The Slow Mo Guys)
A recent viral video features mesmerizing footage of a giant octopus kite flown at a kite festival in Singapore earlier this month. The kite’s arms twist and wave lazily in the breeze. Watching the video, I was struck by how realistic the kite’s motion looks. It really looks like an octopus is just cruising there in mid-air. And that resemblance might not be accidental.
In fluid dynamics, scientists often use a concept called dynamic similitude to test the physics of a scale model instead of the full-size original. The simplest version of this uses the Reynolds number to compare the model and the original. The Reynolds number is a dimensionless number that depends on the object’s size, the flow’s speed, and the density and viscosity of the fluid. If you match the scale model’s Reynolds number to the original’s Reynolds number, then the physics will be the same – even if you changed the fluid or the size of the object.
Returning to our kite, one thing the footage doesn’t entirely convey is just how enormous this kite really is. The Straits Times reports the kite is about the length of five buses and requires six people to get aloft. But the kite’s size helps compensate for the fact that it’s flying in air instead of swimming through viscous water like a real octopus. Although I’m left estimating the kite’s size and the wind’s speed, my quick calculations put the Reynolds numbers for the kite and the octopus on the order of 10,000. So, strange as it seems, this giant kite really is acting like a swimming octopus!
Movement in Earth’s oceans is driven by a complicated interplay of many factors like temperature, salinity, and Earth’s rotation. Above are results from a numerical simulation of the top 100 meters of ocean contained within a 1 km x 1 km box. The colors indicate surface temperature. Two major processes create the motion we see. The first is convection, in which water at the surface releases heat to the atmosphere and cools, causing it to then sink due to its greater density. Warmer water rises to replace it. This process happens quickly and dominates the early part of the simulation where we see the puffy convection cells shown on the left animation.
A slower process is in effect as well. Because of variations in the water temperature, the density of the fluid at a given depth is not constant. We can already see that at the water surface, where the temperature (and thus density) is varying significantly. Those variations in density at the same depth combined with gravity’s tendency to shift fluids create what is known as a baroclinic instability. Put simply, this instability will cause warmer water to slide horizontally past colder water. The result is the large, spinning eddy motion seen in the animation on the right. To see how the whole system develops, check out the full video below. (Image/video credit: J. Callies)