
This spectacular Hubble image shows the Bubble Nebula. The source of this nebula is the star seen toward the upper left side of the bubble. This massive, super-hot star has ceased to fuse hydrogen and is now fusing helium, powering its way to a likely end as a supernova. As it burns, the star emits a stellar wind of gas moving at over 6.4 million kilometers an hour. As the flow moves outward, it encounters colder dense gases that it pushes along as it expands; this is the blue bubble surface that we see. The asymmetry of the bubble with respect to its source star is caused by the variation in the surrounding gas’s density. The bubble’s front moves more slowly in areas with more gas, thus making the bubble appear lop-sided. (Image credit: NASA; via Gizmodo)
Search results for: “density”
Bonbon Coatings

If you’ve ever bitten into a chocolate-covered bonbon, you may have noticed that the candy’s chocolate coating is remarkably uniform. Inspired by this observation, a group of engineers have investigated how viscous fluids poured over a curved surface flow and solidify; their findings were published this week.
Rather than heated chocolate, the group used polymer-filled fluids that cure and harden over time. Interestingly, they found that the final shell is quite uniform and that its thickness does not depend on the pouring technique. Instead, they can predict the final shell thickness based on the radius of the mold and the rheological properties of the fluid–specifically its density, viscosity, and curing time. The reason for this is that the time it takes for the fluid to drain and coat the mold is much shorter than the time it takes for the polymer to cure. As a result, the amount of fluid that sticks to the mold depends on geometry and fluid properties – not how the fluid was poured.
Amateur confectioners rejoice: pouring uniform chocolate coatings may be easier than you thought! (Image credit: MIT News, video; research credit: A. Lee et al.)

Seeing Blast Waves
With a large enough explosion, it’s actually possible to see shock waves. This high-speed camera footage shows the detonation of a car packed with explosives. After the initial flash, you can see the thin membrane of the blast wave expanding outward. This shock wave is a traveling discontinuity in the air’s properties–temperature, pressure, and density all change suddenly over an incredibly small distance. It’s this last variable–density–that enables us to see the effect. Density has a significant impact on air’s index of refraction (which also explains heat mirages). In this case, the shift in refractive index is large enough that we see the difference relative to the background, enabling our eyes to follow an otherwise invisible effect. (Video credit: Mythbusters/Discovery Channel; via Gizmodo)
If you enjoy FYFD, please help support me by becoming a patron!

Ignition
Shown here are the first instants after a bubble full of methane gas is ignited via laser. Using the schlieren optical method and a high-speed camera, scientists recorded the deflagration at 10,000 frames per second. Because schlieren imaging is very sensitive to small changes in density, we see not only the expanding flame front as the methane ignites but also the subtle waviness of the methane expanding into the surrounding air as the bubble bursts. (For comparison, check out what bursting a water balloon looks like at high-speed.) Be sure to head over to ScienceTake for the full schlieren video, and also check out this award-winning video of a match lighting made by the same researcher. (Image credit: V. Miller et. al.; full video: The New York Times; submitted by Rebecca M.)
ETA: An earlier version of this post mistakenly said the demo used a balloon full of methane rather than a bubble. Thanks to jump-first-think-later for the correction.
Cream in Coffee
Pouring cream in coffee produces some of the most mesmerizing displays of fluid dynamics. The density difference between the two fluids sets up Rayleigh-Taylor instabilities that mushroom out and help create the turbulence that eventually mixes the drink. You can learn more about Rayleigh-Taylor instabilities in this FYFD video, and, if you need more awesome caffeine-filled examples of fluids, check out the coffee dynamics blog. (Video credit: S. Geraldine and L. Kang)
Shock Waves in Flight
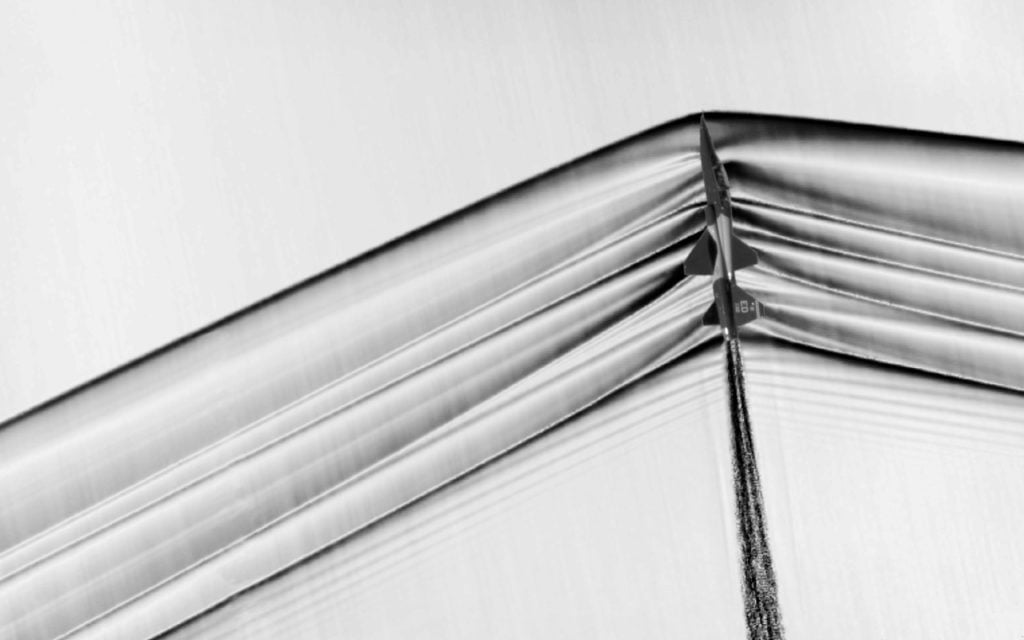
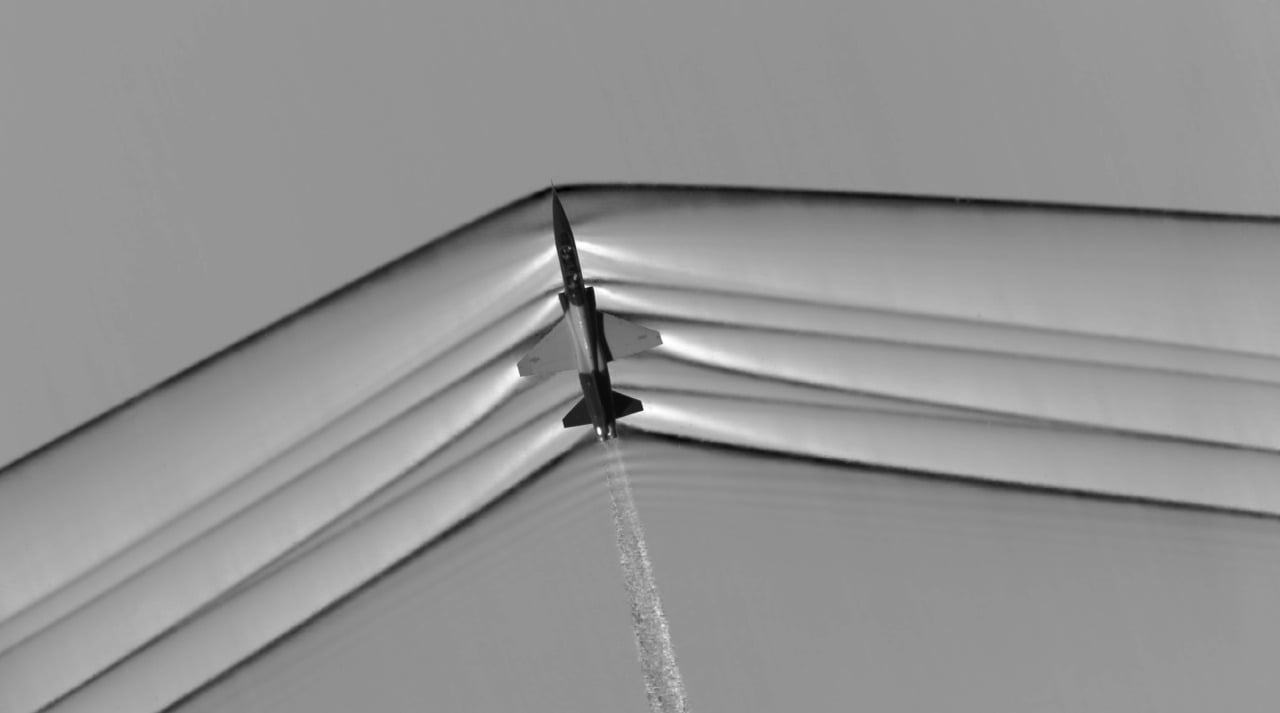
Schlieren optical systems have been used to visualize shock waves in labs for more than a century, but the technique did not translate well to photographing shock structures outside the lab. But now NASA’s Armstrong Research Center and Ames Research Center have developed a method that allows them to capture highly-detailed images of the shock waves around airplanes while they are flying. This is incredible stuff. Be sure to check out the high-resolution versions on this page, along with more description of the coordination necessary to pull off the photos.
The light and dark lines you see emanating from the airplane are places with strong density gradients. The dark lines are mostly shock waves, with the strongest shock waves appearing black due to the large change in air density. Many of the light streaks are expansion fans, areas where the density and pressure drop as air speeds up.
The goal of this research is to better understand shock wave structures around supersonic planes in order to reduce the noise supersonic aircraft cause when flying overhead. As you can see in the photos, the shock waves at the nose and tail of the aircraft persist far away from the aircraft; these are what cause the twin sonic boom heard when the plane flies by. (Photo credit: NASA; via J. Hertzberg)
Convection from a Heat Source
Convection is a major driver in many flows in nature. In this film, the UCLA Spinlab demonstrates buoyant convection caused by a local heat source. They deposit dye on a submerged, continuously heated plate, then observe as the dye slowly rises with the heated (lower density) fluid. The surface forms a cap for the rising dye, which then spreads horizontally. Qualitatively similar flows can be seen in nature over volcanic eruptions or in thunderstorms when clouds reach the troposphere or a capping inversion. Be sure to check out the rest of the Spinlab’s videos. (Video credit: UCLA Spinlab; submitted by Jon B.)
Jumps in Stratified Flows
One of the factors that complicates geophysical flows is that both the atmosphere and the ocean are stratified fluids with many stacked layers of differing densities. These variations in density can generate instabilities, trap rising or sinking fluids, and transmit waves. The animations above show flow over two ridges with dye visualization (top), velocity (middle), and contours of density (bottom). The upstream influence of the left ridge creates a smooth, focused flow that quickly becomes turbulent after the crest. The jet rebounds as a turbulent hydraulic jump before slowing again upstream of the second ridge. Like the first ridge, the second ridge also generates a hydraulic jump on the lee side. Clearly both stratification and the local topography play a big role in how air moves over and between the ridges. If prevailing winds favor these kinds of flows, it can help generate local microclimates. (Image credit and submission: K. Winters, source videos)
Dead Water
Sailors have long known about the “dead water” phenomenon, which can bring ships to a near-standstill, but it was only within the last century that an explanation for the behavior was found. The underlying cause is a stratification of fluids of different densities. As seen in the video above, when a boat moves by exerting a constant force, such as with propellers, it generates an internal wave along the interface between two density layers in the water. As the wave grows in amplitude, it speeds up, chasing and eventually breaking against the boat. The energy that drives the internal wave’s growth comes from the energy the boat expends for propulsion; the larger and closer the wave gets, the slower the boat goes because its energy is sapped by the wave. In the ocean, particularly near sources of freshwater run-off, like melting glaciers, the water can be extremely stratified, with many layers of different salinity and density. The end of the video simulates this with a three-fluid demonstration in which the boat’s motion generates internal waves across multiple density interfaces. (Video credit: M. Mercier et al.)

Blast Waves Visualized
Typically, shock waves are invisible to the human eye. Using sensitive optical techniques like schlieren photography, researchers in a lab can visualize sharp density gradients like shock waves or even the slight density variations caused by natural convection. But it takes some special conditions to make shock waves visible to the naked eye. The blast wave of the explosion in the photo above is a great example. The leading edge of the shock wave and the heat of the explosion create a strong, sharp change in density. That density change is accompanied by a change in the air’s refractive index. As light travels from the distance toward the camera, it’s distorted–more specifically, refracted–when it travels through the blast wave and its wake. And, in this case, that visual distortion is strong enough that we can clearly see the outlines of the shock waves moving out from the explosion. The apparent horizontal line through the blast wave is probably the intersection of a weaker secondary shock wave with the initial expanding shock wave. (Image credit: Defense Research and Development Canada; via io9)