
For the right flow speeds and incidence angles, a jet of Newtonian fluid can bounce off the surface of a bath of the same fluid. This is shown in the photo above with a laser incorporated in the jet to show its integrity throughout the bounce. The walls of the jet direct the laser much the way an optical fiber does. The jet stays separated from the bath by a thin layer of air, which is constantly replenished by the air being entrained by the flowing jet. The rebound is a result of the surface tension of the bath providing force for the bounce. (Photo credit: T. Lockhart et al.)
Search results for: “art”

Stirring Faces
This video features simulation of the laminar flow around a plate plunging sinusoidally in a quiescent flow. As the plate moves up and down, it mixes the fluid around it. This is visualized in several ways, beginning with the vorticity. Clockwise and anti-clockwise vortices are shed by the edges of the plate as it moves. The flow is also visualized using particle trajectories, which are classified by their tendency to accumulate (attract) or lose (repel) particles. These trajectories are particularly intriguing to watch develop as they appear to show ornate faces and designs. (Video credit: S. L. Brunton and C. W. Rowley)
Swirling Jets
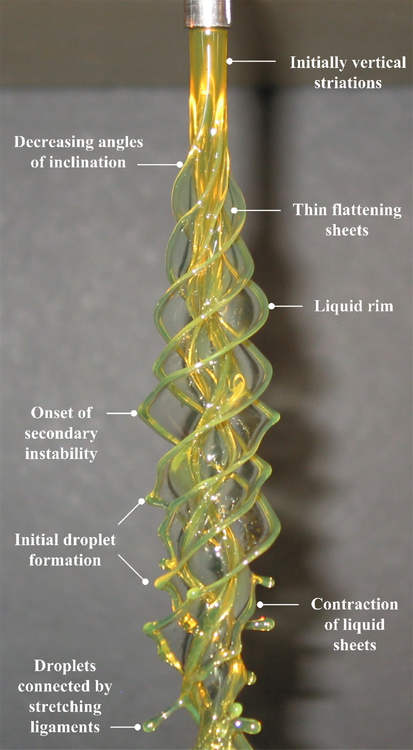
In fluid dynamics, we like to classify flows as laminar–smooth and orderly–or turbulent–chaotic and seemingly random–but rarely is any given flow one or the other. Many flows start out laminar and then transition to turbulence. Often this is due to the introduction of a tiny perturbation which grows due to the flow’s instability and ultimately provokes transition. An instability can typically take more than one form in a given flow, based on the characteristic lengths, velocities, etc. of the flow, and we classify these as instability modes. In the case of the vertical rotating viscous liquid jet shown above, the rotation rate separates one mode (n) from another. As the mode and rotation rate increase, the shape assumed by the rotating liquid becomes more complicated. Within each of these columns, though, we can also observe the transition process. Key features are labeled in the still photograph of the n=4 mode shown below. Initially, the column is smooth and uniform, then small vertical striations appear, developing into sheets that wrap around the jet. But this shape is also unstable and a secondary instability forms on the liquid rim, which causes the formation of droplets that stretch outward on ligaments. Ultimately, these droplets will overcome the surface tension holding them to the jet and the flow will atomize. (Video and photo credits: J. P. Kubitschek and P. D. Weidman)

Saturn’s Polar Vortex


Nothing quite compares to the beauty of fluid dynamics on astronomical scales. What you see here are raw photographs of recent storms at Saturn’s north pole. The recent change in Saturnian seasons has afforded Cassini a sunlit view of the northern pole, which had previously lain in darkness. A roiling vortex filled with clouds being twisted and sheared was revealed near the center of its famed polar hexagon. (Photo credit: NASA/JPL-Caltech/Space Science Institute; submitted by J. Shoer)
Frozen Powder Drops
Droplet impacts on granular surfaces and water interactions with superhydrophobic surfaces are not unfamiliar topics for FYFD. But this behavior of water droplets falling on a superhydrophobic powder is unusual, to say the least. When the droplets impact in powder, they rebound with a partial coating of powder. In the case of the superhydrophobic powder, the shape of the droplet is “frozen” by the powder. A satellite droplet is ejected from the region not coated in powder and the resultant main drop falls back to the surface and comes to rest with little to no deformation. The researchers report a critical velocity at which the behavior is observed. (Video credit: J. Marston et al.; via Physics Buzz)
Reader Question: Dry Rear Windshields in the Rain
Reader sheepnamedpig asks:
I was driving through the rain down the highway when I noticed something strange: though the rain was heavy enough to reduce visibility to a quarter mile, the rear windshield of my Corolla was bone dry except for the streams of water flowing off the roof. There was no wind so far as I could tell, but I had to slow down all the way to ~20-25 mph for rain to start falling on the rear windshield. Why is that?
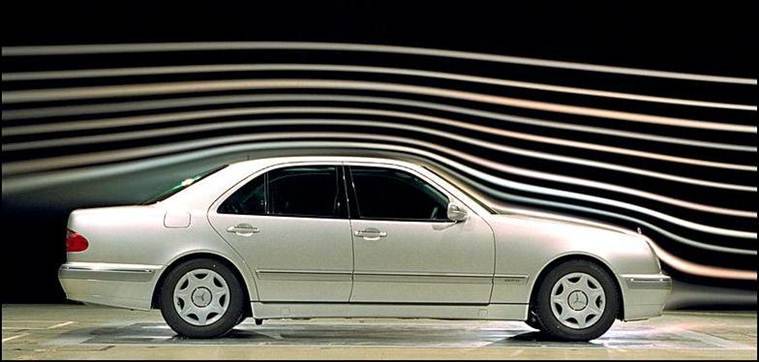
That’s a wonderful observation! Like many sedans, your Corolla has a long, sloped rear window that acts much like a backward-facing step with respect to the airflow while the car is moving. Note the smoke lines in the photo above. At the front of the car, we see closely spaced intact lines near the hood and windshield, indicating relatively fast, smooth airflow over the front of the vehicle. At the back, though, there is a big gap over the rear windshield. This is because flow over the car has separated at the rear windshield and a pocket of recirculating air. This recirculation zone is, for the most part, isolated from the rest of the air moving over the car; that’s why the smoke lines continue relatively unaffected a little ways above the surface. This same pocket of recirculating air is protecting your rear windshield from rainfall. It’s an area of low-speed, high-pressure fluid, and the raindrops are preferentially carried by the high-speed, low-pressure air over the recirculation zone. This is one reason why many sedans don’t have rear windshield wipers. (Photo credit: F-BDA)
ETA: Reposted by request to make it rebloggable.
Superfluid Vortices
Cooling helium to a few degrees Kelvin above absolute zero produces superfluid helium, a substance with some very bizarre behaviors caused by a lack of viscosity. Superfluids exhibit quantum mechanical properties on a macroscopic scale; for example, when rotated, a superfluid’s vorticity is quantized into distinct vortex lines, known as quantum vortices. These vortices can be visualized in a superfluid by introducing solid tracer particles, which congregate inside the vortex line, making it appear as a dotted line, as shown in the video above. When these vortex lines approach one another, they can break and reconnect into new vortices. These reconnections provoke helical Kelvin waves, a phenomenon that had not been directly observed until the present work by E. Fonda and colleagues. They are even able to show that the waves they observe match several proposed models for the behavior. (Video credit: E. Fonda et al.)
Sharkskin’s Secrets

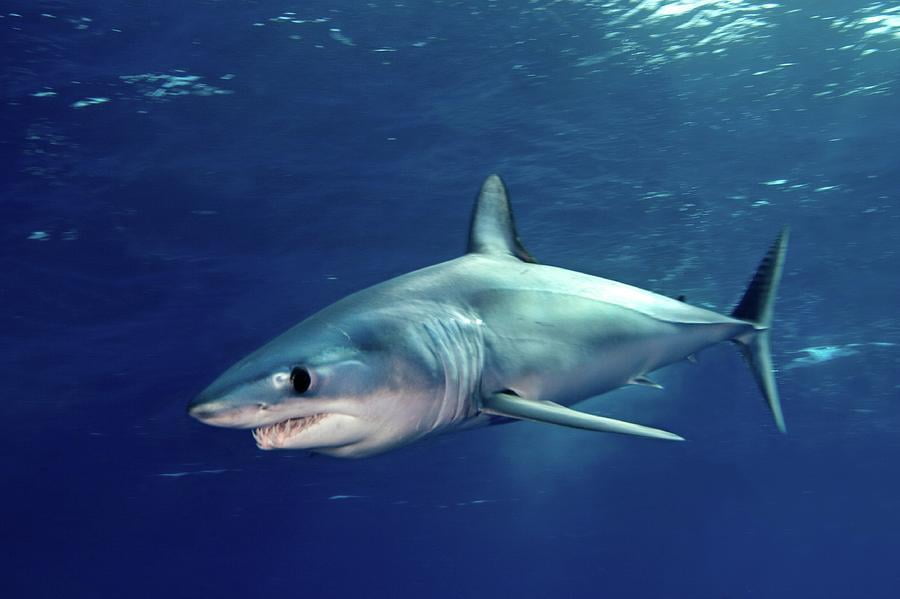
Sharks are known as extremely fast and agile swimmers, due in part to the surface of their skin. Sharks are covered in very tiny tooth-shaped scales called denticles which are streamlined in the direction of flow over the shark. If you were to run a hand over a shark’s skin from head to tail, it would feel silky smooth, but rub against the grain and it’s like running your hand on sandpaper. Water encounters a similar resistance, which, according to new research, provides the shark with a passive flow control mechanism, requiring no effort on the part of the shark. When water near the shark’s denticles tries to reverse direction, an early stage in flow separation, the denticles naturally bristle, slowing and trapping the reversed flow. This prevents local flow separation which would otherwise increase the shark’s drag and hinder its agility. (Photo credit: James R. D. Scott; Research by A. Lang et al.)

“Kusho”


Artist Shinichi Maruyama uses photography to freeze the transient motion of fluids into water sculptures. Inertia, gravity, and surface tension are at war in each piece. Plateau-Rayleigh instabilities break long filaments of liquid into droplets that splash, collide, and reform. To see how he makes this art, check out his videos. (Photo credits: Shinichi Maruyama)
Grooving Bubbles
Here bubbles in a microchannel are subjected to an external ultrasonic acoustic field. Under the influence of this vibration, the bubbles self-organize into crystal-like structures with a fixed finite separation distance. Some bubbles cluster and contact. Some bubbles also pulsate in star-shaped vibration modes. When the external sound is turned off, the bubble crystal loses form and drifts apart. For more, see Rabaud et al. 2011. (Video credit: P. Marmottant et al.)