Category: Research

  • How Large Particles Get in Sea Spray

    How Large Particles Get in Sea Spray

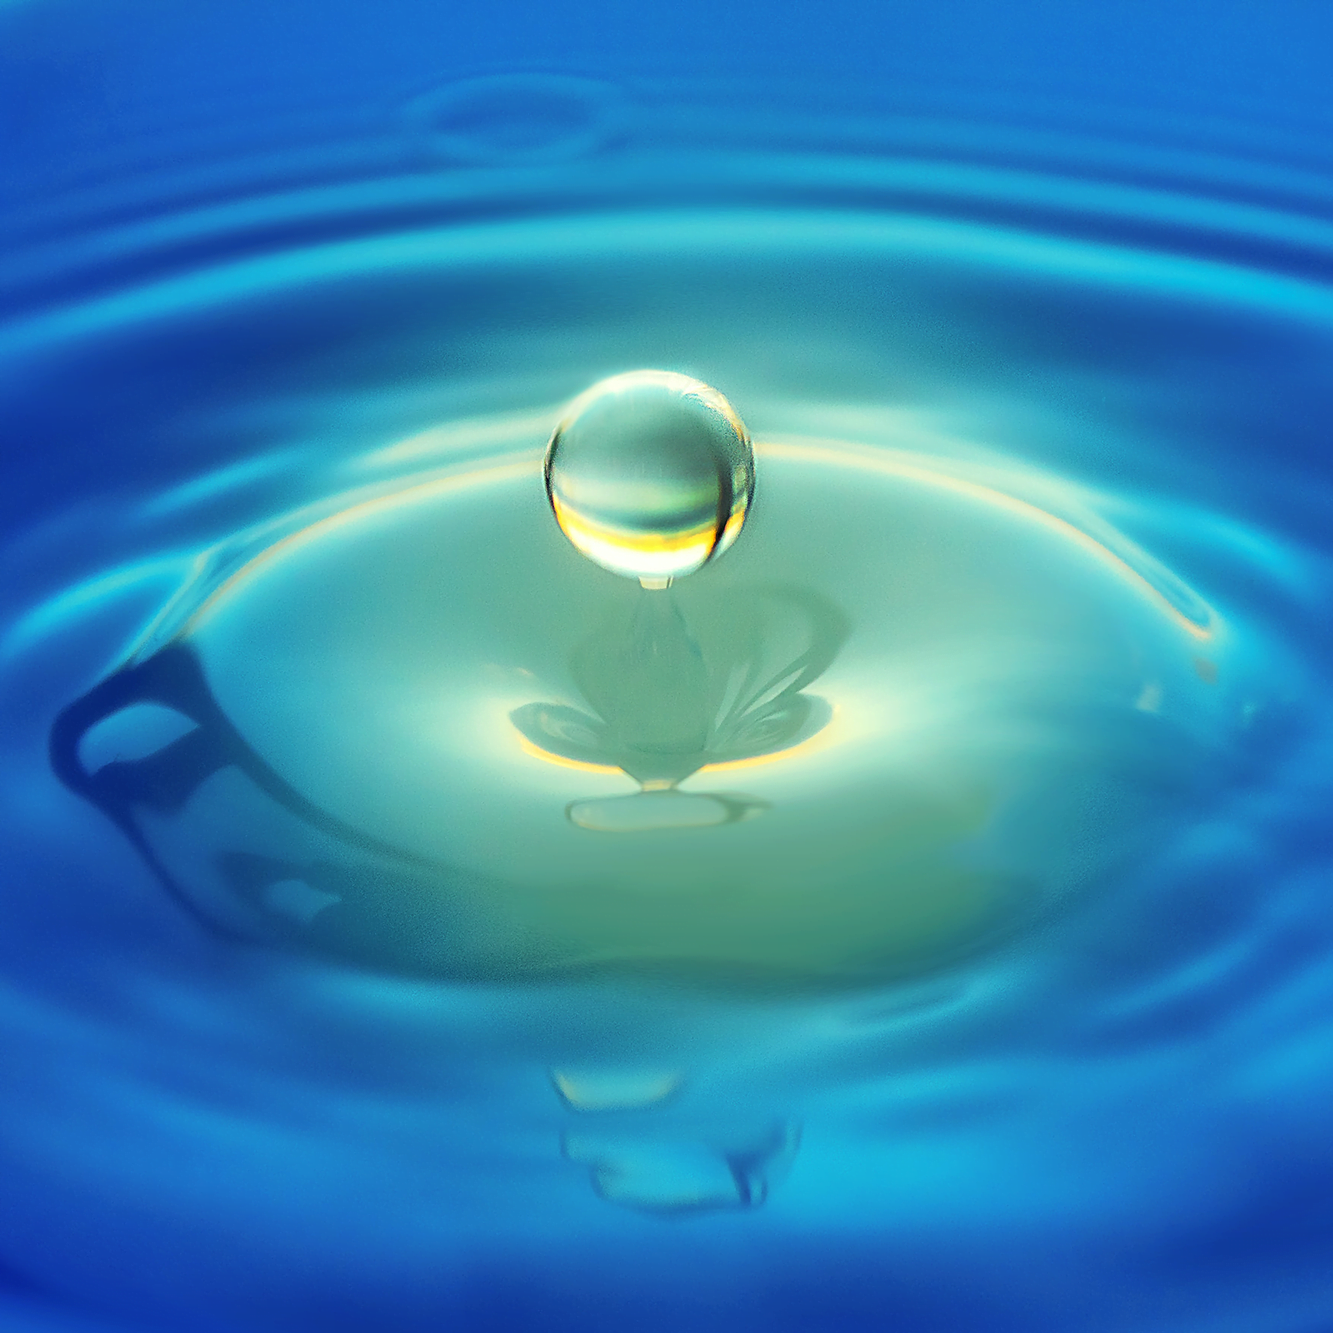
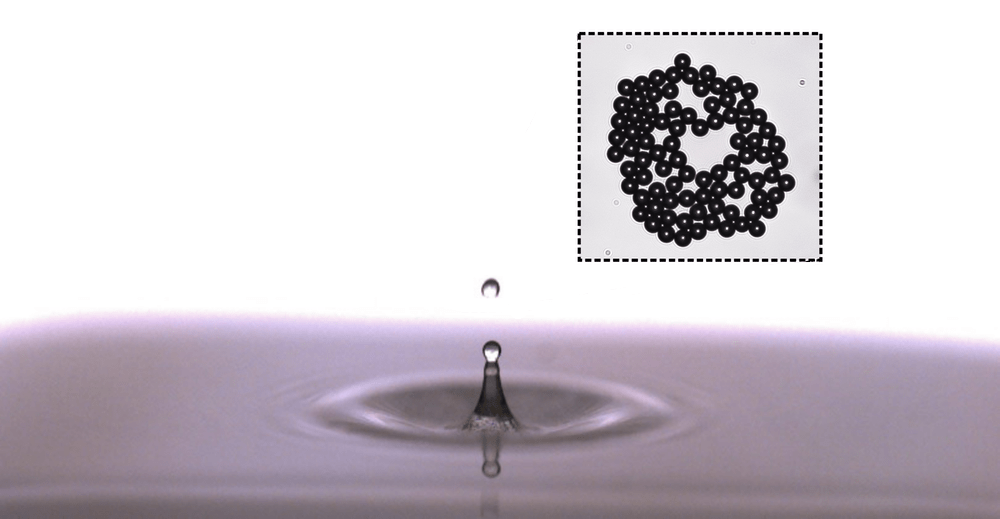
    When bubbles burst at the ocean’s surface, they eject droplets that can carry high concentrations of contaminants like pollutants, viruses, and microplastics. Previous theories posited that only particles smaller than the microlayer surrounding the bubble could make their way into these drops, but new work shows otherwise.

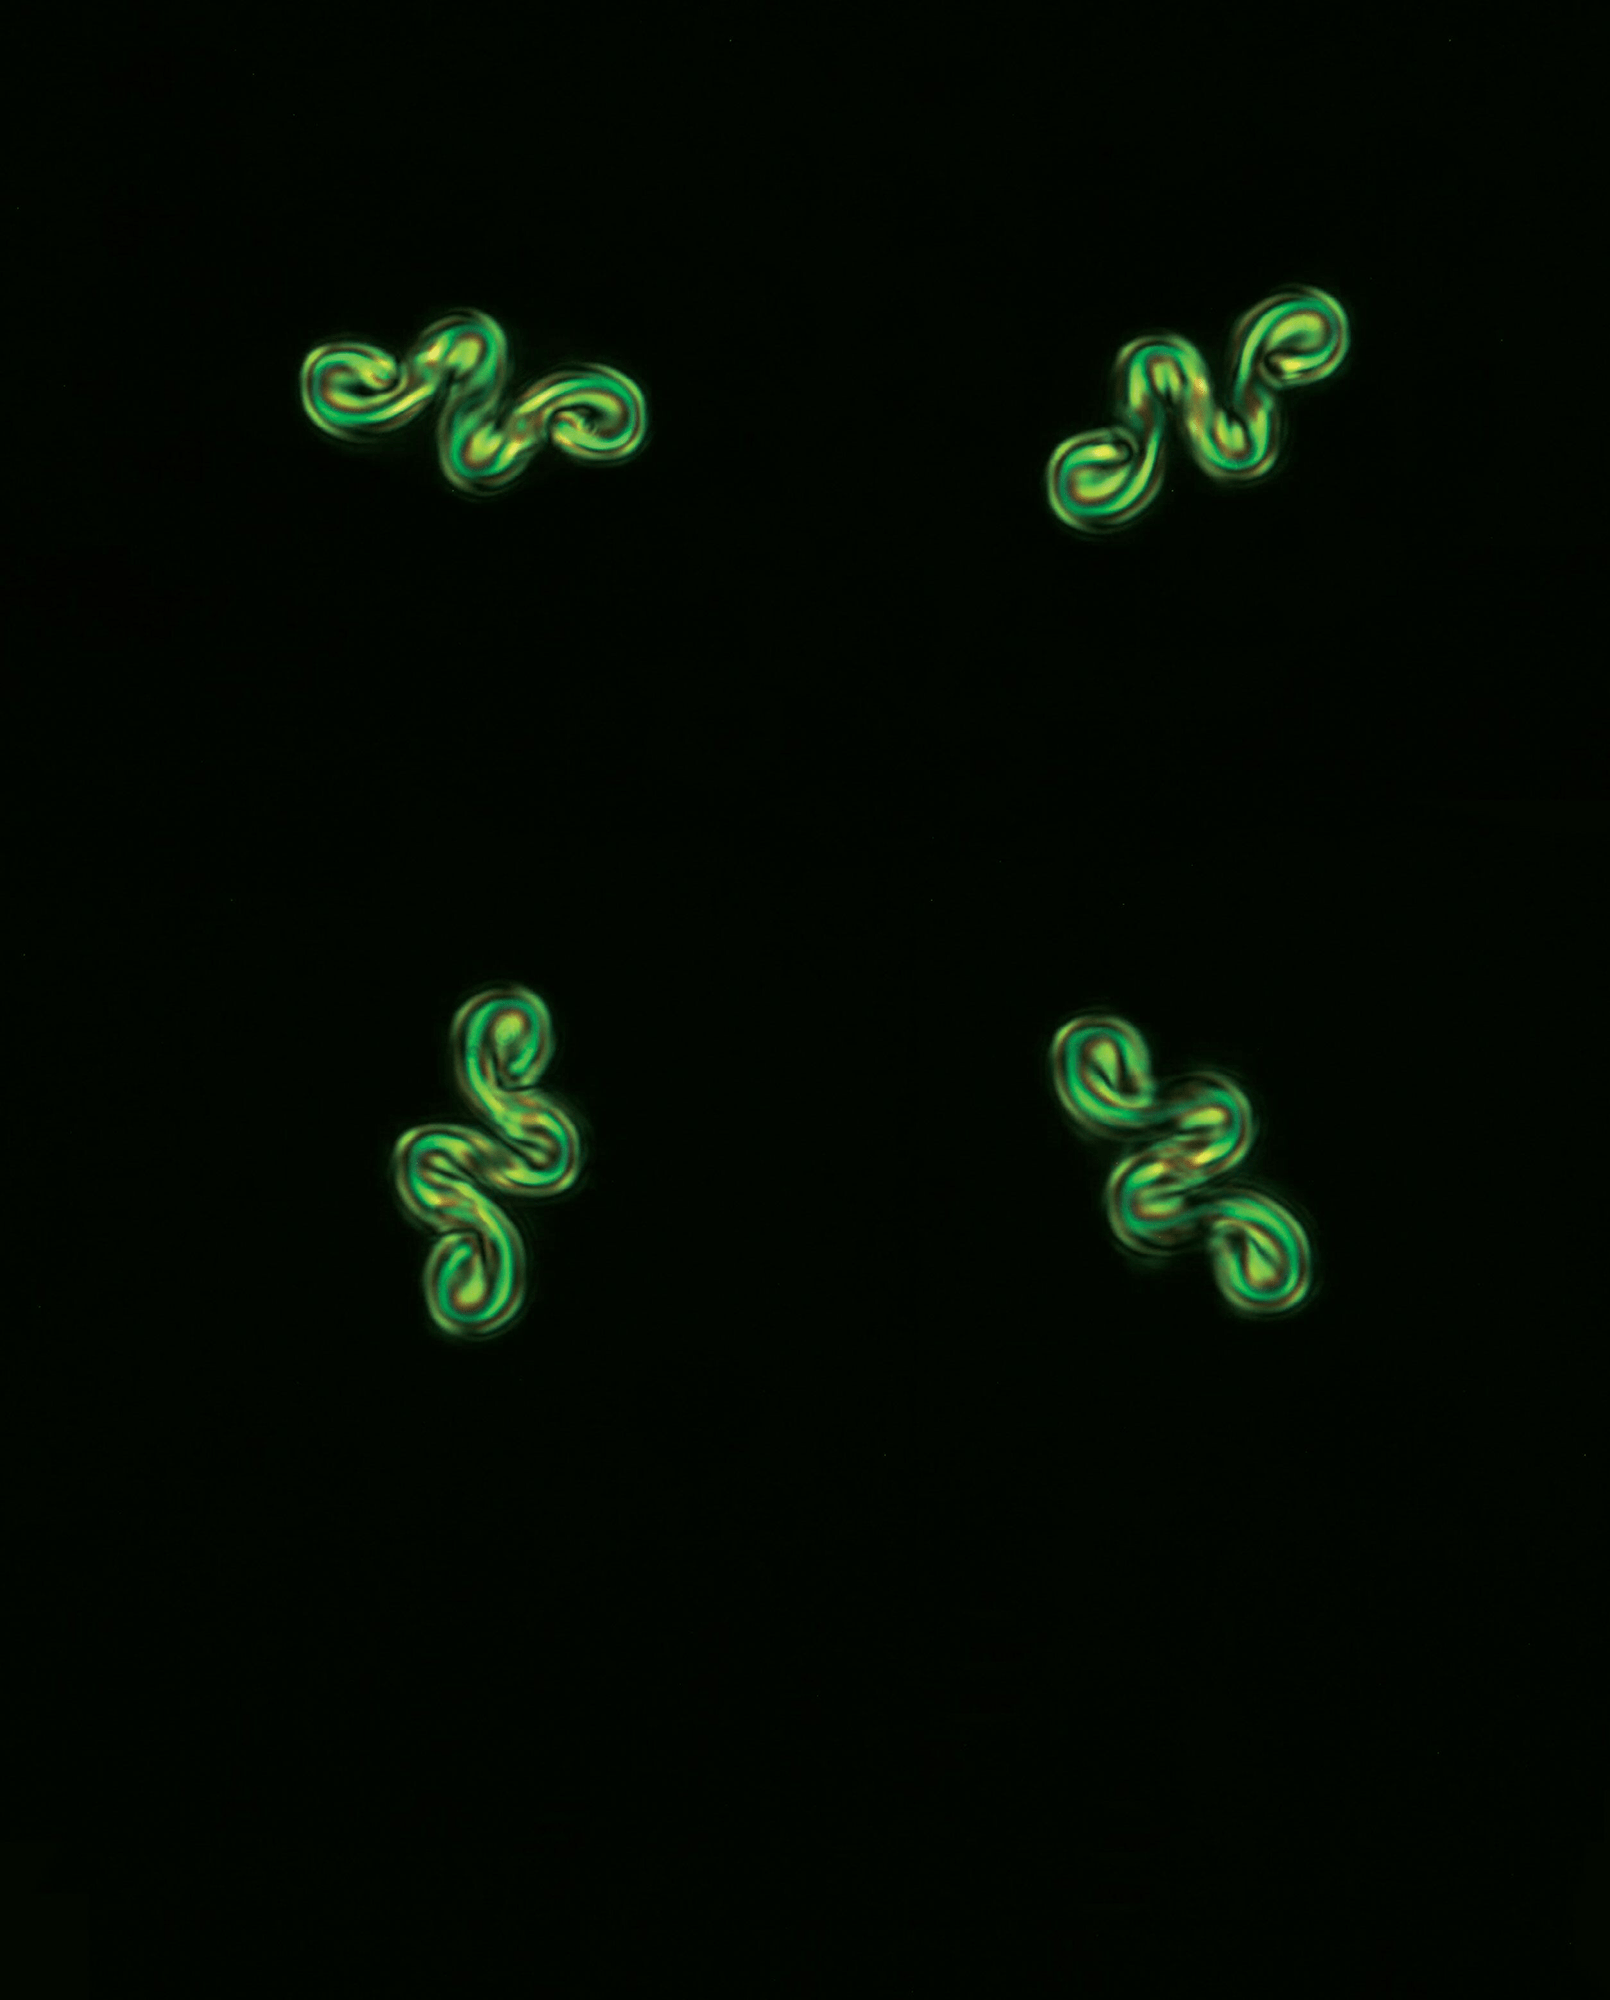
    As bubbles rise to the surface, they carry particles on their surface, collecting them to a concentration that’s even higher than the surrounding seawater. But which particles make it into the air depend on the details of what happens when the bubble pops. Previously, researchers assumed that the thin microlayer of fluid surrounding the bubble was uniform, but that turns out not to be the case. As the bubble pops, some regions of the microlayer stretch and thin, while others grow thicker. The thicker the microlayer, the larger the particles it can pull along. In their single-bubble experiments, the researchers found that 15- and 30-micrometer plastic beads — representing oceanic microplastics — appeared in high concentrations in ejected droplets.

    This animated simulation shows how fluid along the edge of a bubble makes its way into ejected droplets. Green particles indicate fluid from the left half of the bubble; blue shows fluid from the right side.
    This animated simulation shows how fluid along the edge of a bubble makes its way into ejected droplets. Green particles indicate fluid from the left half of the bubble; blue shows fluid from the right side.

    Environmental scientists are keen to understand these mechanisms because they link our oceans and atmosphere, potentially affecting rainfall, pollution spread, and epidemiology. (Image, video, and research credit: L. Dubitsky et al.; via APS Physics)

  • Instabilities on Instabilities

    Instabilities on Instabilities

    The world of fluid instabilities is a rich one. Combine fluids with differing viscosities, densities, or flow speeds and they’ll often break down in picturesque and predictable manners. Here, researchers explore the Rayleigh-Taylor instability (RTI), which occurs when a denser fluid sits above a less dense one (in a gravitational field). It’s an extremely common instability, showing up in both the cream in your ice coffee and the shape of a supernova’s explosion. It’s very difficult to set up and observe, though, which is where the real cleverness of this experiment stands out.

    To study the RTI, these researchers first created another instability, the Saffman-Taylor instability. They filled the space between two glass plates with a viscous fluid, then injected a less viscous one. That created the distinctive viscous fingering pattern seen in the top image. In addition to being less viscous, the injected fluid was also less dense. As it pushed into the original fluid, it displaced some of it, creating a three-layer structure with dense fluid over less-dense fluid over dense fluid. That laid the groundwork for the Rayleigh-Taylor instability form.

    A side-view through the fluid mixture shows the characteristic mushroom-like plume of the Rayleigh-Taylor instability.
    A side-view through the fluid mixture shows the characteristic mushroom-like plume of the Rayleigh-Taylor instability.

    Check out the cell-like pattern distributed across the fluid in the top image. These are plumes formed in the RTI as dense fluid sinks into the less-dense fluid below it. From the side (see second image), each plume takes on the distinctive mushroom-like shape of a Rayleigh-Taylor instability. Given time, the two fluids mix and the cellular pattern disappears. But until then, this set-up uses one instability to study a second one. How cool is that?! (Image and research credit: S. Alqatari et al., see also)

  • Möbius-Like Liquid Crystals

    Möbius-Like Liquid Crystals

    Möbius strips are nonintuitive objects. They appear multi-dimensional but are single-sided. Such topologies show up in other systems, too. Here we see a liquid crystal where molecular alignments, along with vortices in the fluid, result in tiny, three-dimensional shapes nicknamed “möbiusons,” thanks to their unusual properties. Each one is about 10 μm long. The researchers found that these möbiusons can spontaneously fold into many configurations. But under an electrical field, the möbiusons can self-propel and remain stable through many motions, including rotation. Such behaviors could be useful for transporting nano-sized cargo. (Image and research credit: H. Zhao et al.; via Physics Today)

  • A Bubble’s Path

    A Bubble’s Path

    Centuries ago, Leonardo da Vinci noticed something peculiar about bubbles rising through water. Small bubbles followed a straight path, but slightly larger ones swung back and forth or corkscrewed upward. The mechanism behind this behavior has been a matter of debate ever since, but the authors of a recent study believe they’ve nailed down the answer.

    The forces determining a bubble’s path are remarkably complex, which is why it’s taken so long to figure this out. Viscosity acts as a source of drag on the rising bubble, acting across a thin boundary region surrounding the bubble. That boundary isn’t constant, though; the bubble’s shape changes as the flow pushes on it, and the changing shape of the bubble pushes on the flow, in turn. Capturing those subtle interactions numerically and comparing them to careful experiments was necessary to unravel the mystery.

    The team found that bubbles above a critical radius (0.926 millimeters) begin to tilt. That tilt causes a change in the bubble’s shape, which increases the flow along one side. This kicks off the wobbling motion, which carries on because of the continuing changes in the bubble’s shape and the flow around it. (Image credit: A. Grey; research credit: M. Herrada and J. Eggers; via Vice; submitted by @lediva)

  • The Chicxulub Impact’s Tsunami

    The Chicxulub Impact’s Tsunami

    66 million years ago an asteroid struck offshore of what is now Chicxulub near the Yucatán Peninsula in Mexico. The impact and its aftermath are widely credited with a mass extinction that wiped out 75% of plant and animal life on Earth, including non-avian dinosaurs. Since the impact occurred in shallow waters, it also generated a tsunami, one over 30,000 times bigger than any in recorded history.

    Snapshot showing the spreading tsunami after the asteroid's impact.
    Snapshot showing the spreading tsunami after the asteroid’s impact. Click on the image to go to NOAA’s website and watch the video.

    In this simulation, researchers show how that tsunami spread globally. The initial wave was about a mile high but stretched up to about 2.5 miles as it rushed ashore. Worldwide, every shoreline saw flows at 20 cm/s or higher as the wave hit. In the image above, black areas show the landmasses as they existed at the time, with modern borders shown in white outline. To watch the video, click on the image or head to NOAA’s visualization.

    You may wonder how scientists can validate a simulation like this one, which so wildly exceeds any recorded event. One way they judged these results is by looking at the sedimentary records of the seafloor. Their results show flows large enough to scour the seafloor and disrupt any sedimentary records in those areas, and, sure enough, those regions hold no records older than the asteroid’s impact. That alignment between the geological record and the simulation’s highest flow areas helps establish confidence in the results. (Image credit: illustration – SWRI/D. Davis, simulation – NOAA; research credit: M. Range et al.; submitted by Kam-Yung Soh)

  • Dandelion Seeds

    Dandelion Seeds

    Each seed on the head of a dandelion has a preferred wind direction, according to new research. Seeds facing the breeze are most likely to release from the head, with those facing other directions holding on tens to hundreds of times harder — until their breeze comes along. To measure the force needed to pluck a dandelion seed, researchers superglued a fine wire to individual seeds and pulled from different directions. This seed-by-seed removal mimics winds from varying angles and allowed the researchers to test the directional dependence of seed release. With seeds poised to release in every direction, the dandelion ensures its successful spread. (Image credit: S. Chaudhry; research credit: J. Shields and C. Roh; via Science News; submitted by Kam-Yung Soh)

  • The Optical Atom

    The Optical Atom

    Researchers applied a quantum mechanical technique to study an evaporating drop in extreme detail. The team trapped a spherical water drop and collected the light scattered off it as it evaporated. Using an analytic technique originally developed for an atom, they were able to study changes in the drop down to the nanometric level without relying on numerical simulations to interpret the results. The authors suggest that their method is well-suited to studying the concentration of chemical or biological contaminants on the surface of a drop as it evaporates. (Image credit: droplet – Z. Kaiyv, Fano combs – J. Marmolejo et al.; research credit: J. Marmolejo et al.; via APS Physics)

    Illustration of the Fano combs seen by analyzing light scattered from an evaporating drop.
    Illustration of the Fano combs seen by analyzing light scattered from an evaporating drop.
  • Martian Wind Power

    Martian Wind Power

    To support a crew on Mars, a landing site must offer resources like water and allow for sufficient power generation. Thus far, most analyses of this sort have focused on the possibilities of solar power, which is limited by day-and-night cycles and seasonal variations, and nuclear power, which carries some risk to the human crew. In a new report, researchers considered the possibilities of wind power on Mars.

    Since Mars’s atmosphere is so much thinner than Earth’s, wind power has largely been overlooked as an energy source there. But researchers found that a commercially-rated wind turbine expected to produce 330 kW here on Earth could still output a respectable 10 kW on Mars. Since the target power needs for a crew are 24 kW, adding wind energy can boost a power system from providing 40% of needs from solar alone to 60-90% of the needed energy from combined solar and wind sources. A wind turbine is especially helpful in supplementing power needs at times when solar power wanes, like at night or during the Martian winter solstice. (Image credit: NASA; research credit: V. Hartwick et al.; via Physics World)

  • Swimming Intermittently

    Swimming Intermittently

    Many fish do not swim continuously; instead, they use an intermittent motion, swimming in a sudden burst and then coasting. This intermittent swimming is tough to simulate, due to its unsteady nature, but a new study does so using some clever computational techniques.

    Animation showing a fish swimming in a burst-and-coast pattern.
    Animation showing a fish swimming in a burst-and-coast pattern.

    Researchers suspected that the energy intensity of a fish’s burst could be balanced by the low-drag, low-effort phase of coasting. And, indeed, that’s consistent with the team’s results. But they found that the swimming method does require careful optimization; with the wrong cadence, the burst-and-coast technique can be incredibly energy intensive. In nature, of course, fish have had millions of years to optimize their technique, but the results serve as a warning to those building fish-based robots. Those biorobots will need careful optimization to benefit from this swimming style. (Image credit: tetra – Adobe Stock Images, simulation – G. Li et al.; research credit: G. Li et al.; via APS Physics; submitted by Kam-Yung Soh)

  • Mixing With E. Coli

    Mixing With E. Coli

    What happens when a flow meets swimming micro-organisms? Does the flow affect the swimmers? And how do the swimmers affect the flow in turn? Those are the questions behind the experiment seen here. The apparatus contains a thin layer of saline water with swimming E. coli. Electromagnetism is used to mix the fluid in an array-like pattern that triggers chaotic mixing. To visualize what’s going on, dye is introduced into the right half of the image, while the left half remains undyed.

    On the right side of the image, bright blue and white mark areas of high dye concentration, where strong mixing occurs. On the undyed left side of the image, pale blue streaks mark areas where E. coli are clustered. By comparing the two, we see that the micro-swimmers are clustered in the very same regions of flow marked by strong mixing. This result suggests strong interactions and the potential for feedback between the mixing flow and the swimmers. (Image and research credit: R. Ran et al.; see also 1 and 2)