Look closely at old paintings, and you’ll notice arrays of tiny, straight cracks that form as the paint dried. This sort of pattern formation during drying is not unusual. Here we see the patterns formed when a thin layer of hydrogel sandwiched between two glass plates dries. As the water evaporates, stress builds at the interface between the air and gel, causing bubbles to form. The bubble size and shape depend on the size on the gap between the plates and the characteristics of the gel. The resulting patterns can be entirely disordered, or they can form worm-like designs that curl throughout the domain. (Image and research credit: R. Pic et al.)
Year: 2019

Robotic Research Facilities
One of the major challenges in fluid dynamics is the size of the parameter spaces we have to explore. Because many problems in fluid dynamics are non-linear, making small changes in the initial set-up can result in large differences in the results. Consider, for example, a simple cylinder towed through a water tank. As the cylinder moves, vortices will form around it and shed off the back, causing the cylinder to vibrate. The details of what will happen will depend on variables like the cylinder’s size and flexibility, the speed it’s being towed at, and which directions it’s allowed to vibrate in. Mapping out the parameter space, even sparsely, could take a graduate student hundreds of experiments.
To speed up this process, engineers are now building robotic facilities like the Intelligent Towing Tank (ITT) shown above. Like graduate students, the ITT can work into the wee hours of the night, but, unlike graduate students, it never needs to eat, sleep, or stop experimenting. Now, one could use a facility like this to brute-force the answers by testing every possible combination of parameters, but even working 24 hours a day, that would take a long time. Instead, researchers use machine learning to guide the robotic facility into choosing test parameters in a way that optimizes the factors the researchers define as important.
Essentially, the system starts with experiments chosen at random within the parameter space, and then uses those results to select areas of interest until it’s gathered enough data to satisfy the limits specified by human researchers. In theory, a well-designed algorithm can dramatically reduce the number of experiments needed to explore a parameter space. (Image and research credit: D. Fan et al.; submitted by Kam-Yung Soh)

Envisioning Chemical Patterns


One of the most beautiful chemical reactions is the Belousov–Zhabotinsky reaction, and it’s the subject of the latest video from Beauty of Science. Known colloquially as the BZ reaction, it begins as growing spots of color that turn into rings and chaotic spirals as the chemical reaction progresses.
Mathematically, the BZ reaction is a type of reaction-diffusion system, meaning that the patterns we see depend both on the speed of local chemical reactions and the time necessary for chemical reagents to move (or diffuse) throughout the dish. Although the diffusion in these systems can simply be the random wandering of molecules, fluid dynamics also plays a role. Variations in chemical concentration between different regions of the reaction drive fluid flows that continue to feed the pattern-making until all the reagents are consumed. (Image and video credit: Beauty of Science; via PetaPixel; submitted by clogwog)

Falling Drops and Forming Stalagmites


The vast stalactites and stalagmites found in caves take millennia to form. Mineral-rich water seeps down the icicle-like stalactites and then drips onto stalagmites below, each drop depositing a little more calcite onto the growing rock. By observing this dripping action first-hand, researchers found that most falling drops create a splash that’s much smaller than the width of the stalagmite they fall onto. So how do stalagmites end up so wide?
It turns out that there’s a large variance in where drops hit the stalagmite. There’s no wind in these caves to push the droplets, so researchers concluded the drop’s trajectory depends on the vortices it sheds as it falls. A drop that falls from a short height will have a vertical trajectory. But once the drop is falling tens of meters, it can end up as many as several centimeters to the side of where it would fall in a vacuum. This scatter-shot variation in drop impacts is what enables stalagmites to grow so wide. (Image and research credit: J. Parmentier et al., source; via NYTimes; submitted by Kam-Yung Soh)
An Introduction to the Reynolds Number
For those who’d like an overview of the mathematics involved in fluid dynamics, Numberphile has a lovely introduction, given by our friend Tom Crawford. The governing equations in fluid dynamics, the Navier-Stokes equations, are quite complicated, but that’s just been inspiration for scientists and mathematicians to come up with clever ways to simplify them. And, ultimately, that’s what the Reynolds number is — a way to help us judge which forces, and therefore which mathematical terms, are the most important in a given problem. (Video credit: Numberphile; submitted by COMPLETE)


Flow on Commercial Wings
Even in an era of supercomputers, there is a place for quick and dirty methods of flow visualization. Here we see a model of a swept wing like those seen on many commercial airliners. It was painted with a layer of fluorescent oil, then placed in a wind tunnel and subjected to flow. As air blows across the model, it moves the oil, leaving behind streaks that show how air near the surface moves.
We can see, for example, that near the fuselage, the air flows mostly front to back across the wing. That’s what we expect, especially for a wing generating lift. But further out on the wing, the flow moves mostly along the wing, not across it. There’s also a distinctive line running just a short ways behind the leading edge on this outer section of wing. It looks as though air flowing over the wing separated at this point, leaving disordered and unhelpful flow behind. It’s likely that the model was tested at an angle of attack where the outer section of the wing was beginning to stall. (Image credit: ARA)

CU Flow Vis 2019


I love when science and art come together, which is why I’ve long been a fan of the Flow Vis course at CU Boulder. Some of my earliest posts on FYFD date from previous editions of the course. Here are a few of my favorite images from the Fall 2019 class, from the top:
- Ferrofluid and India ink merge in this colorful photo. A magnet underneath the mixture on the left side causes the dark spikes of ferrofluid, but without magnetic influence, the ink and ferrofluid form cell-like droplets.
- Although it looks like a shower head, this is actually fluorescent oobleck dripping through a strainer. A relatively long exposure time means that it’s impossible to tell whether the oobleck is falling in a fluid stream or broken-up chunks.
- These colorful water droplets are sitting on a hydrophobic surface, hence their extremely rounded edges. I particularly like how this makes each one like a little lens for the light shining through them and into their shadows.
- A thin layer of ferrofluid reacts to the magnet beneath. Gotta love those little streaks left behind the flow.
For those in the Front Range area, the Flow Vis class will be showcasing their work on Saturday, December 14th at the Fiske Planetarium. Snacks are at 4:30 pm and the show starts at 5 pm. For those not nearby, you can peruse the art from this semester and previous ones at your leisure online. (Image credits: colorful ferrofluid – R. Drevno; falling oobleck – A. Kumar; droplets – A. Barron; macro ferrofluid – A. Zetley)

Inside the Earth’s Mantle
Plate tectonics is a relatively young scientific theory, only gaining traction among geologists in the late 60s and early 70s. One key tenet of the theory is subduction where plates meet and one is forced down into the mantle, like in this illustration of the subduction zone near Japan. In early incarnations of the theory what happens to that subducting slab of rock once it’s in the mantle were ignored. But over the decades, geologists have built maps of the interior of our planet through the seismic waves they record. What they’ve found is that the continental chunks that break off and sink can have long-lasting effects.
Beneath the Earth’s crust, the mantle behaves like an extremely slow-moving fluid under incredibly high temperatures and pressures. It can take tens of millions of years, but those broken slabs sink through the mantle, dragging fluid with them. This creates a large-scale flow known as a mantle wind, which can have far-reaching effects at the Earth’s surface. Through modeling and simulation, geologists have found these deep mantle flows may explain why mountain ranges like the Himalayas and Andes didn’t grow until millions of years after their plates collided and why earthquakes sometimes occur far from plate boundaries. For more, check out this great article from Ars Technica. (Image credit: British Geological Survey; via Ars Technica; submitted by Kam-Yung Soh)
“Magic Fluids”


In his short film, “Magic Fluids,” Roman De Giuli uses cyan, magenta, and yellow paints to generate a rainbow of macro colors. All the fluid motion you see is a practical effect, painstakingly created by layering paints and flow mediums of different densities. Like in Siqueiros’ “accidental painting” technique, the less dense paints will eventually rise through the upper layers and spread. De Giuli uses the effect for its motion, but the same physics is key for many artists who use acrylic pouring to paint. (Video and image credit: R. De Giuli)

Understanding Wildfire


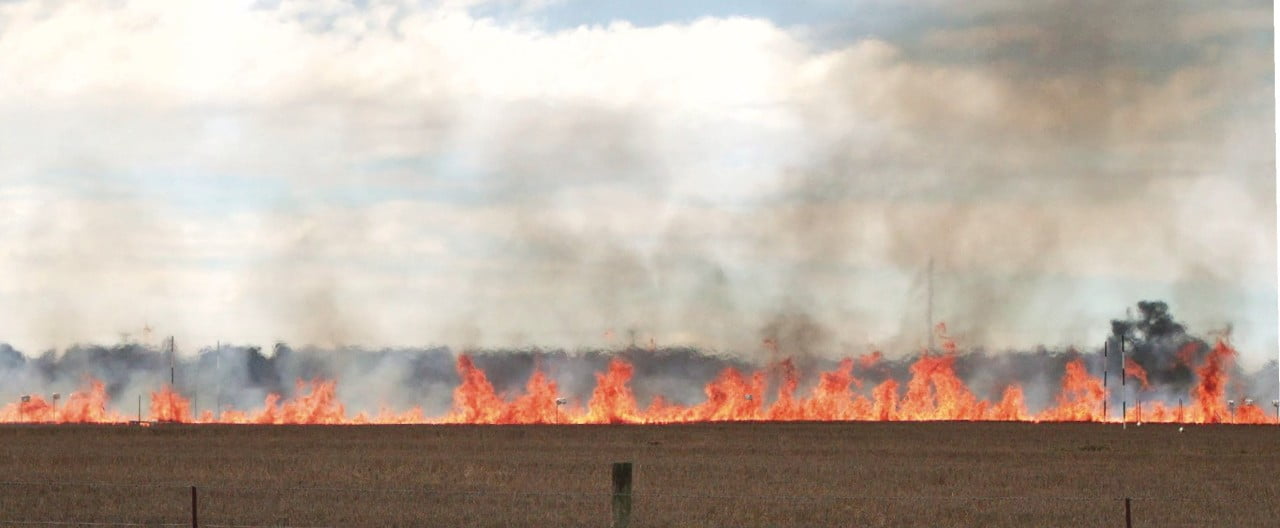
Wildfires are an ongoing challenge in the western United States, where droughts and warmer conditions have combined with a century of fire suppression to form perfect conditions for monstrous fires. It’s long been understood that ambient winds can drive spreading fire, but the connection between wildfire and wind is more complicated than this.
The heat of a fire drives buoyant air to rise, creating tower-like updrafts in a flame front. We see this both in the shape of the grass fire above, and in the wind vectors of a simulated grass fire in the lower image. Between those towers are troughs where cooler ambient wind is drawn in to replace the rising air. How a fire spreads will depend on the speed, direction, and temperature of these winds. A hot wind fed by the fire’s heat will raise the temperature of fuel in unburned areas, bringing it closer to ignition. In contrast, cooler ambient winds can hinder a fire by keeping nearby grass and twigs too cool to ignite. (Image credit: fire – M. Finney/US Forest Service; simulation – R. Linn; research credit: R. Linn et al.; for more, see Physics Today)