The latest FYFD/JFM video is out, and it’s all about the interactions between structures and flows! We learn about plesiosaur-inspired underwater robots, how turbulence affects air-water interfaces, and how adding a tail can help hide an object in a flow. If you missed one of the previous episodes in this series, you can find them all here. (Image and video credit: T. Crawford and N. Sharp)
With some help from Physics Girl and her friends, Grant Sanderson at 3Blue1Brown has a nice video introduction to turbulence, complete with neat homemade laser-sheet illuminations of turbulent flows. Grant explains some of the basics of what turbulence is (and isn’t) and gives viewers a look at the equations that govern flow – as befits a mathematics channel!
There’s also an introduction to Kolmogorov’s theorem, which, to date, has been one of the most successful theoretical approaches to understanding turbulence. It describes how energy is passed from large eddies in the flow to smaller ones, and it’s been tested extensively in the nearly 80 years since its first appearance. Just how well the theory holds, and what situations it breaks down in, are still topics of active research and debate. (Video and image credit: G. Sanderson/3Blue1Brown; submitted by Maria-Isabel C.)
Turbulence – that pestersome, unpredictable, and chaotic state of flow – has been a thorn in the sides of mathematicians, physicists, and engineers for centuries. It is certainly one of – if not the – oldest unsolved problem in physics. Over at Ars Technica, Lee Phillips has a nice overview of the situation, including what makes the problem so difficult:
The Navier-Stokes equation is difficult to solve because it is nonlinear. This word is thrown around quite a bit, but here it means something specific. You can build up a complicated solution to a linear equation by adding up many simple solutions. An example you may be aware of is sound: the equation for sound waves is linear, so you can build up a complex sound by adding together many simple sounds of different frequencies (“harmonics”). Elementary quantum mechanics is also linear; the Schrödinger equation allows you to add together solutions to find a new solution.
But fluid dynamics doesn’t work this way: the nonlinearity of the Navier-Stokes equation means that you can’t build solutions by adding together simpler solutions. This is part of the reason that Heisenberg’s mathematical genius, which served him so well in helping to invent quantum mechanics, was put to such a severe test when it came to turbulence.
Phillips goes on to describe some of the many methods researchers use to unravel the mysteries of turbulence computationally, experimentally, and theoretically. This is a great introduction for those curious to get a sense of how turbulence, stability theory, and computational fluid dynamics all fit together. (Image credits: L. Da Vinci; NASA; see also: Ars Technica; submitted by Kam Yung-Soh)
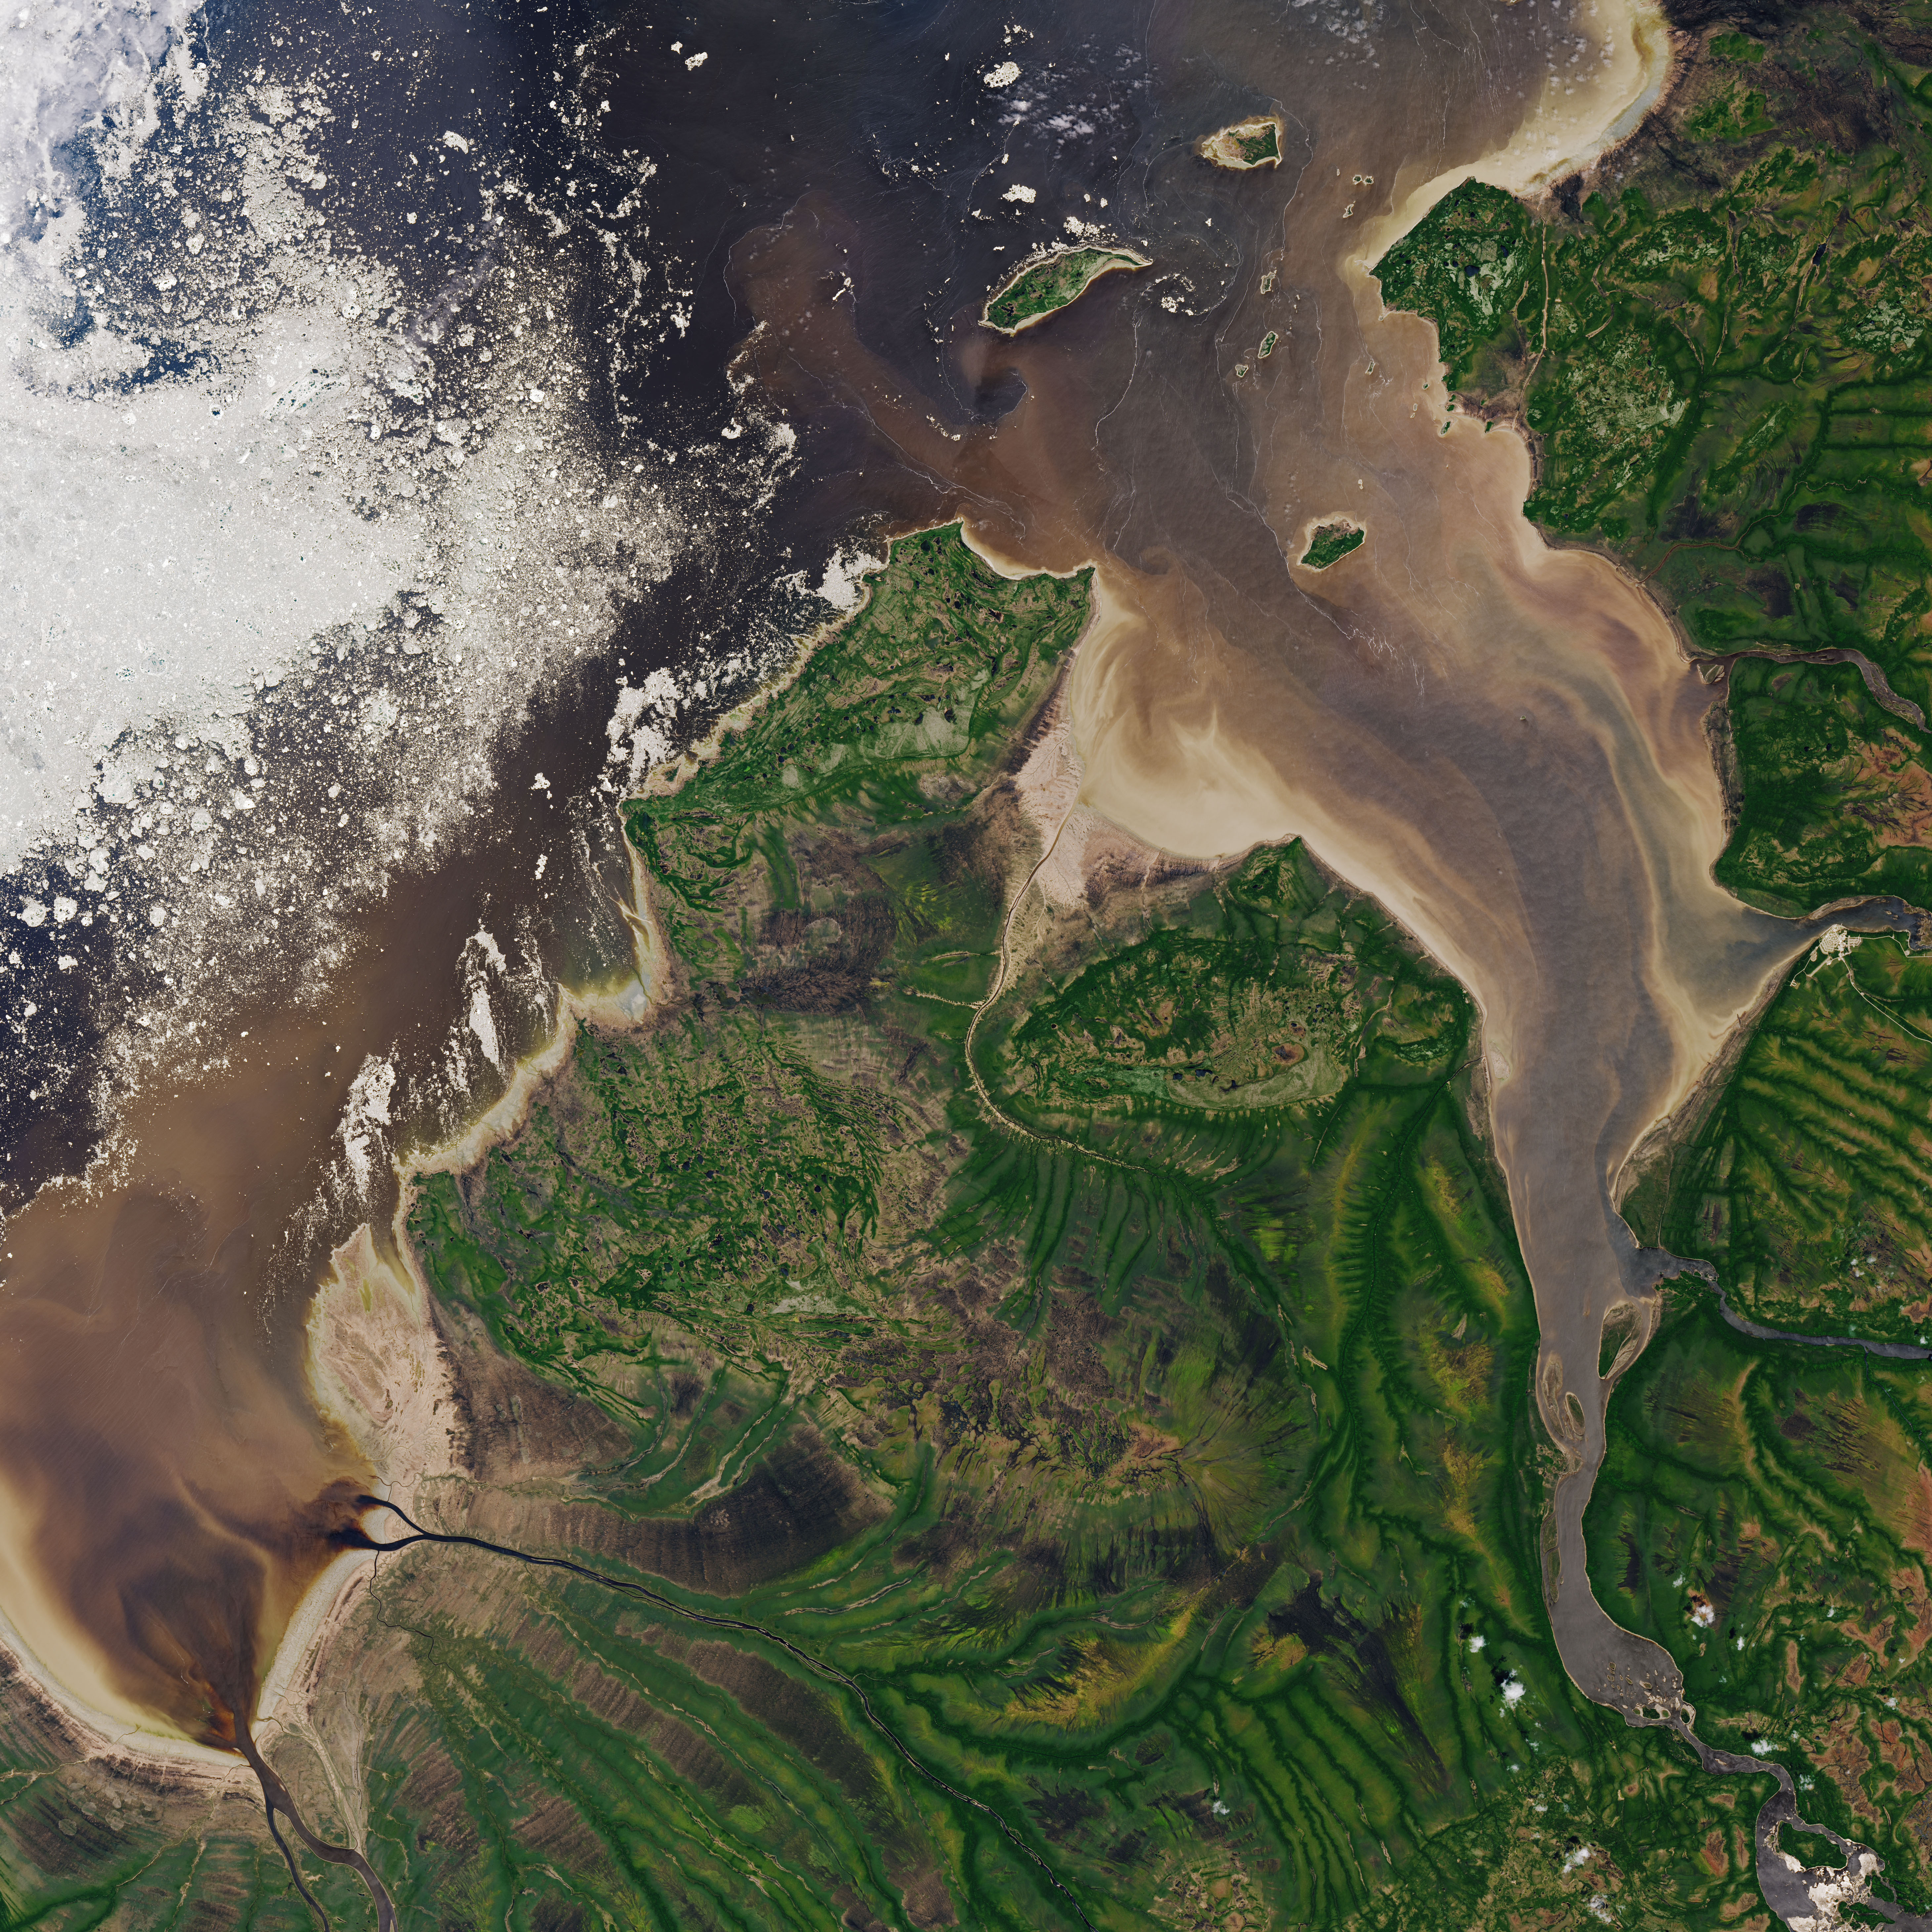
Fluid dynamics often play out on a scale that’s difficult to appreciate from our earthbound perspective, but fortunately, we have tools to aid us. This natural-color satellite image shows Rupert Bay in Quebec, where fresh water stained with sediments and organic matter (right) flows into the saltier water of James Bay (left). White filaments at the edges of these mixing regions are likely foam floating atop the water. The turbulence caused at the intersection of the two bodies of water whips up organic films to form bubbles. The white on the far left of the image is ice chunks still floating in James Bay when the image was taken in early June. Click through to admire the high-resolution version. (Image credit: U.S. Geological Survey; via NASA Earth Observatory)
The Cranston wildfire in California is intense enough that it’s creating its own weather. This timelapse video shows the formation and growth of a pyrocumulus cloud, also associated with volcanoes, over the wildfire. In both instances, the extreme heat causes a massive column of hot, turbulent air to rise. Because ash and smoke are carried upward as well, there are many places for any moisture in the atmosphere to nucleate, forming the cloud we see. In timelapse, the roiling nature of the air’s motion is especially apparent. This turbulence can be dangerous, as it may contribute to high winds and even lightning, both of which can spread the fire further. (Video credit: J. Morris; via James H.)
Every four years, Adidas creates a newly designed ball for the World Cup. This year’s version is the Telstar 18, which features six glued panels (no stitching!) with a slightly raised texture. That subtle roughness is an important feature for the ball’s aerodynamics. It helps ensure that flow around the ball will become turbulent at relatively low speeds. Some previous designs, notably the 2010 Jabulani, were so smooth that flow near the ball would not become turbulent until much higher speeds. In fact, one side of the ball might have laminar flow while the other was turbulent, causing the ball to wobble and misbehave. To learn more about World Cup aerodynamics and the importance of a little surface roughness to the ball’s behavior, check out the Physics Girl video below. (Image credit: Adidas; via APS News; video credit: Physics Girl)
Turbulence, the chaotic regime of fluid dynamics, is a complicated beast. It’s hard to analyze or predict, but we do understand some general ideas about it, like the fact that energy starts out in large eddies, cascades down smaller and smaller ones, and finally gets dissipated at the smallest scales, where viscosity snuffs them out. But that’s only true in three dimensions.
Two-dimensional turbulence – what you get when you confine your fluid to a flat plane – is even weirder. When turbulence is flat, you can actually get an inverse energy cascade, where the energy of small eddies can add up to feed bigger ones. For awhile, this was treated as a mathematical curiosity; after all, we live in a three-dimensional world. But there are situations in life that are nearly two-dimensional, like the surface of a soap bubble or the atmosphere of a planet (which is typically exceptionally thin compared to the planet’s radius). And, little by little, scientists are collecting evidence that this inverse cascade – a flow of energy from small scales to larger ones – does actually happen in the real world. Understanding how this works may explain why hurricanes can intensify even when conditions are “wrong” and how Jupiter’s Great Red Spot has persisted for centuries. To learn more, check out Quanta Magazine’s full article on the work. (Image credit: NASA et al., M. Appel; via Quanta; submitted by Kam-Yung Soh)
Turbulence, the seemingly random and chaotic state that fluids often tend toward, can be difficult to wrap one’s head around. Turn your faucet on high or pour milk into your coffee, and the flow just looks like a completely unpredictable mess. But there are important patterns to be found.These flows have many different lengthscales and timescales to them. Think of a cloud. There are very large-scale motions that are close to the size of the entire cloud, but there are also very small ones that may be only a centimeter or so in size.
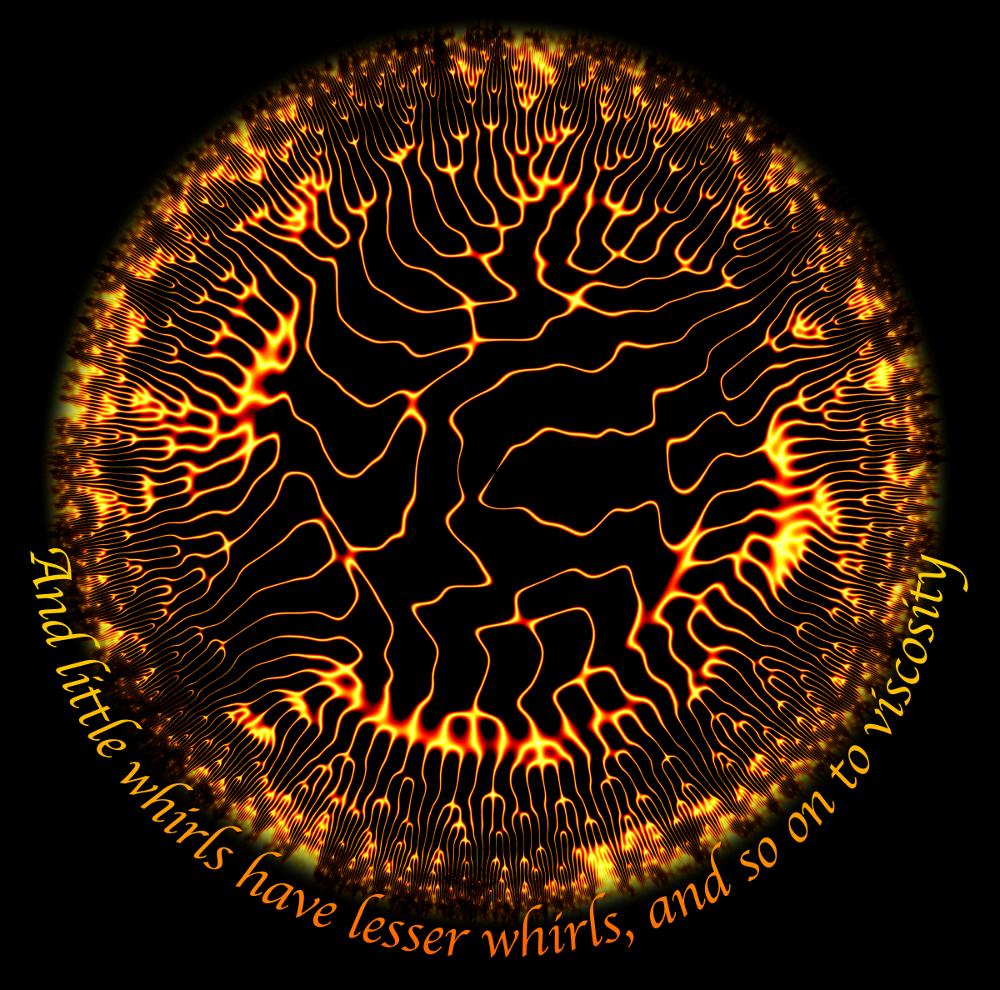
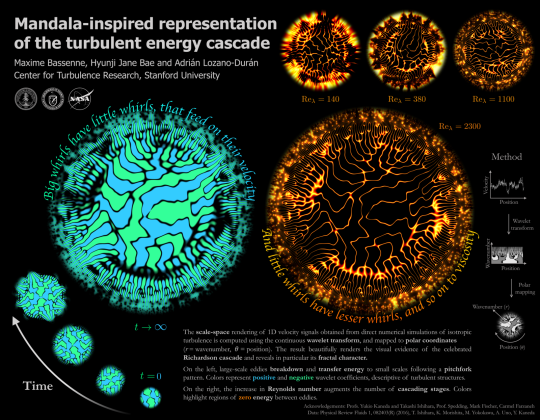
Our best understanding of turbulence so far says that energy starts out in these large scales and slowly works its way down to the smaller ones, where viscosity (essentially friction, in this case) can transform that motion into heat. Above you see a creative way to display this fact. Using data from a numerical simulation, the authors transformed velocity information into these mandala-like patterns. The center of the image represents the large lengthscales, where energy is added. Moving around the circle, like a clock’s hand does, shows different positions in space. Moving radially from the center outward takes you through different lengthscales from large to small.
Notice how the large lengthscales break into smaller and smaller ones as you move outward. The pattern looks like a set of fractal pitchforks, with each lengthscale fracturing into smaller and smaller ones as the turbulence breaks down further. There’s lots more to see in the original poster, below, but you should really click here for the glorious full-size original. The poem, by the way, is the work of physicist Lewis Richardson, who wrote it to summarize how turbulence works. (Image credit: M. Bassenne et al.)
Flames are inherently fascinating to watch. Most of the ones we see regularly, like candle flames and campfires, tend to flicker unsteadily due to their turbulence. But larger fires have a spell-binding nature all their own, one that’s highlighted in slow motion. Here the Slow Mo Guys take flame-gazing to a new level by circling a fireball with a high-speed camera. In the resulting footage, you can admire the incredible expansion of the flame front, and the beautiful, detailed turbulence that creates all the myriad tiny eddies you see in the slow motion. It’s well worth watching more than once! (Video and image credit: The Slow Mo Guys)
Space, as I’ve discussed previously, is surprisingly full of matter, especially clouds of dust. And yet the rate of star formation we observe is bizarrely low; the Milky Way, for example, produces only about one solar mass worth of new stars every year. If gravity were the sole force driving star formation, we’d see far more stars forming. Recent research suggests that turbulence plays a major role in regulating the star formation process, both by countering gravity’s attempts to collapse gases into a proto-star and by creating supersonicshocks that drive material together to jump-start star formation. There seem to be other important ingredients as well: young stars tend to form jets that blow material back into the interstellar clouds they’re forming in, feeding the turbulent background. For more, check out Physics Today. (Image credit: ESA/NASA/Hubble/ESO, via APOD; research credit: C. Federrath)


