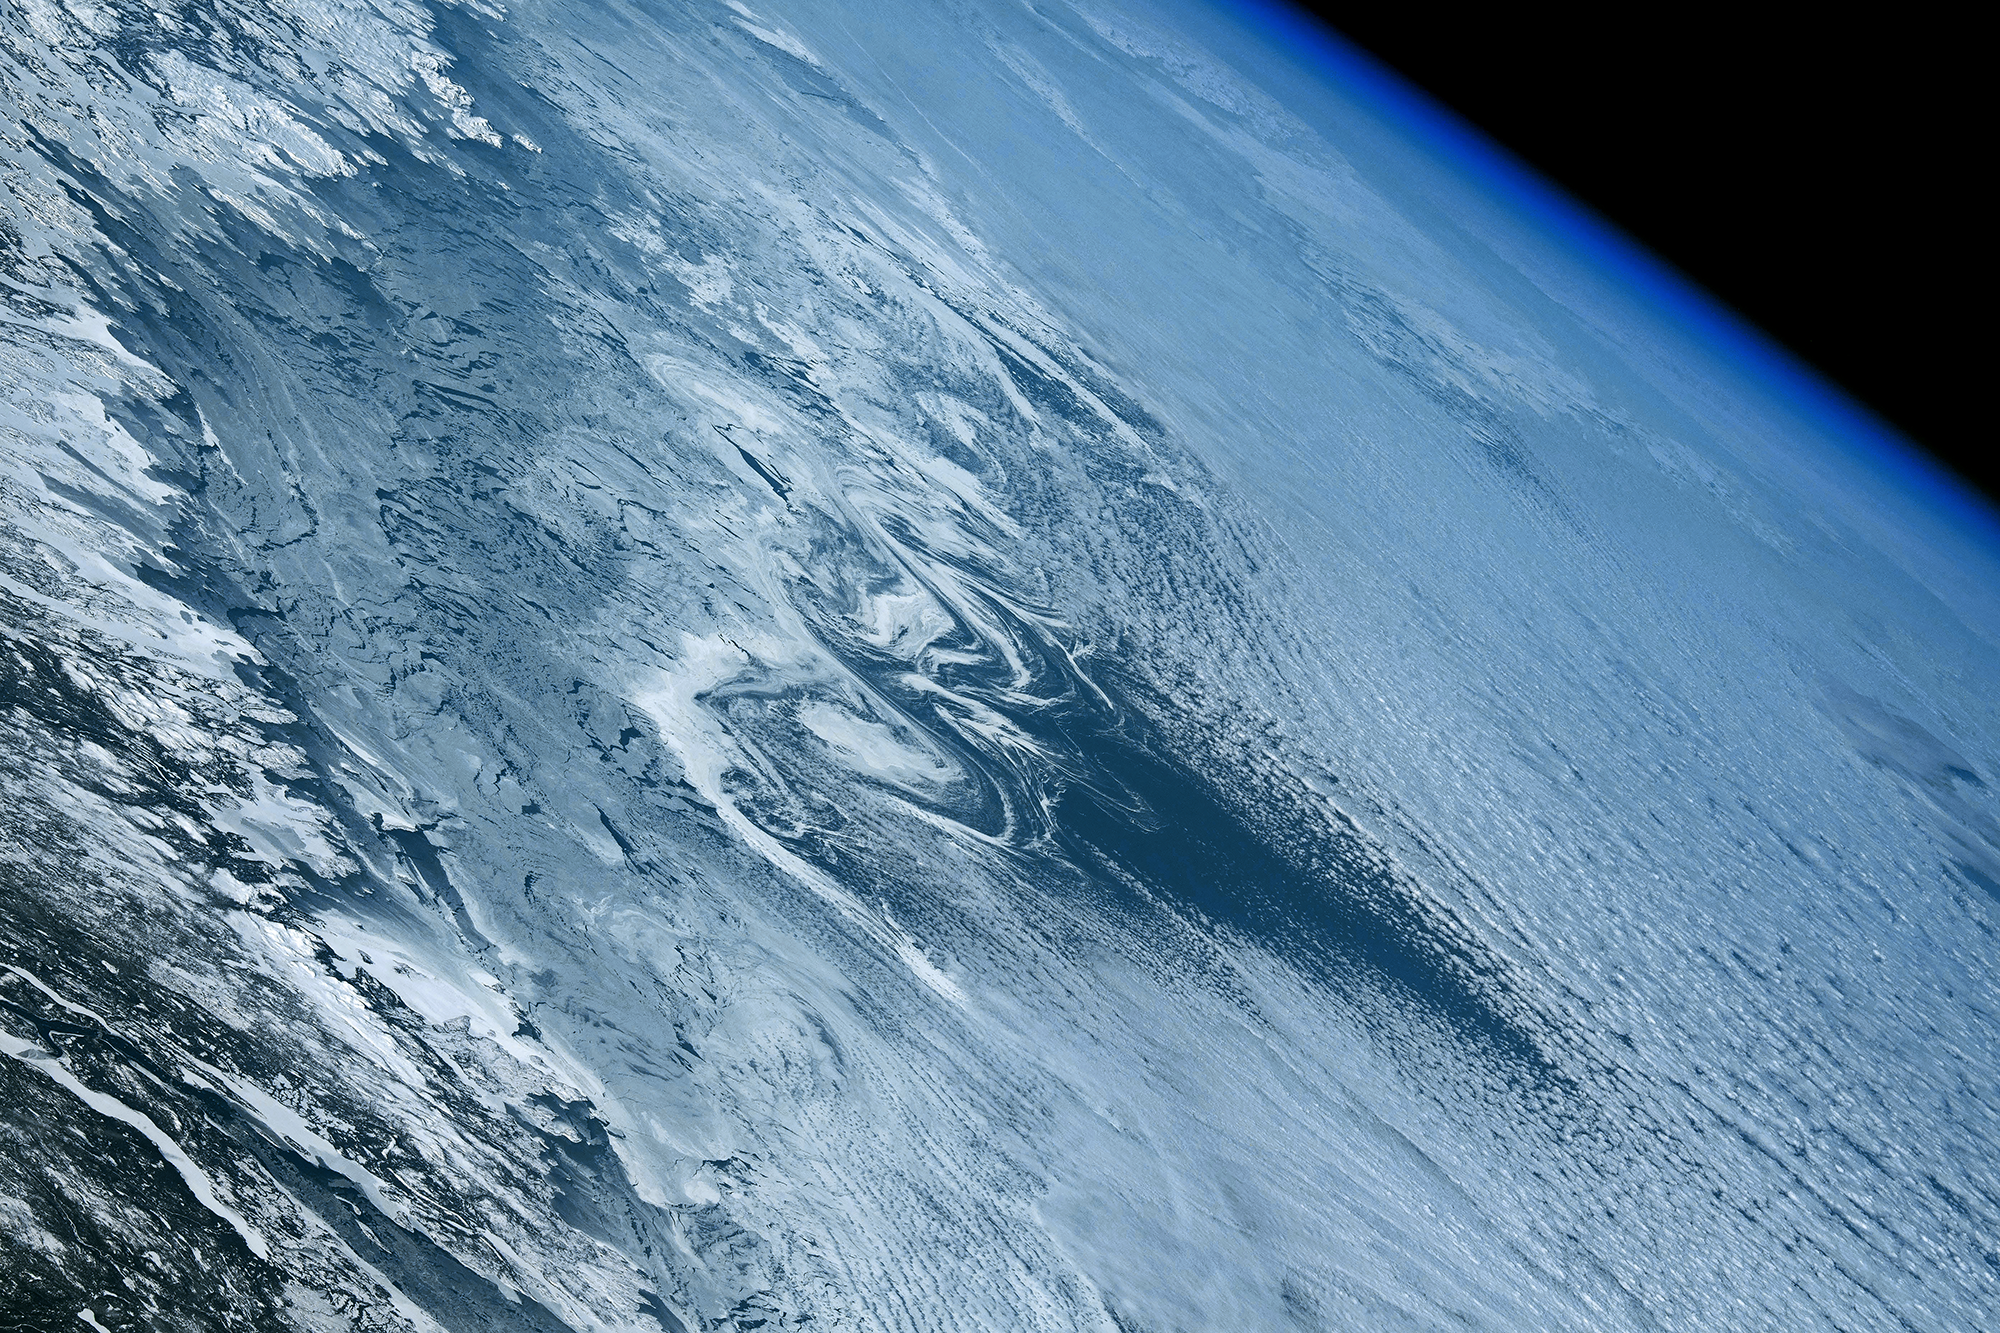
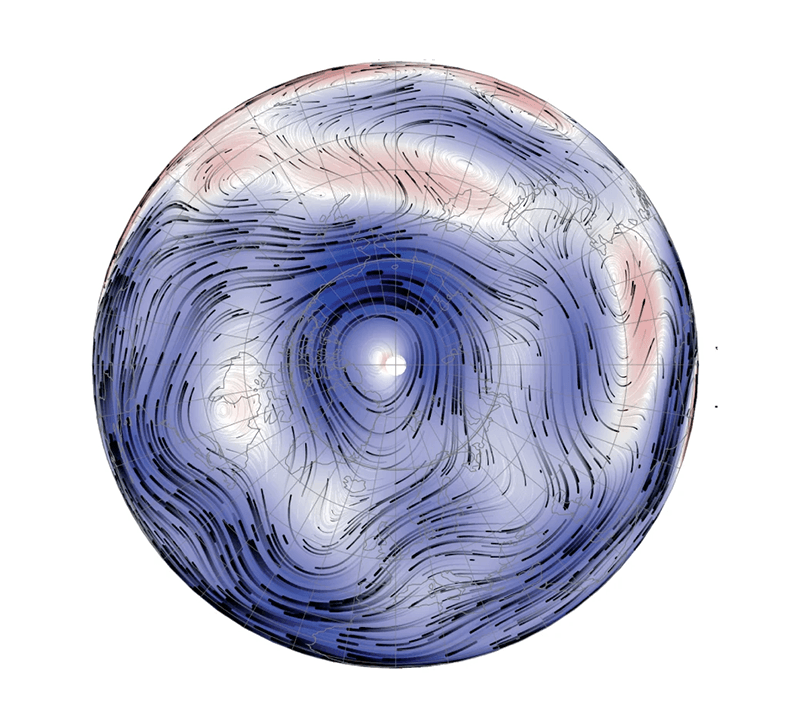
Tag: science

  • Swirls of Green and Teal

    Swirls of Green and Teal

    Captured in March 2024, this satellite image of the Gulf of Oman comes from an instrument aboard the PACE spacecraft. The picture of a phytoplankton bloom is not quite natural-color, at least not as our eyes would see it. Instead, engineers combined data taken from multiple wavelengths and adjusted it to bring out the fine details. It’s not what we’d see by eye, but every feature you see here is real.

    Traditionally, the only way to identify the species of a phytoplankton bloom like this one is by taking a sample directly. But PACE’s instruments can detect hundreds of wavelengths of light, offering enough color detail that scientists may soon be able to identify and track phytoplankton species by satellite image alone. I wonder if distinguishing species could also provide some quantitative flow visualization from a series of these images. In the meantime, at least we can enjoy the view! (Image credit: J. Knuble; via NASA Earth Observatory)

  • Measuring Microfibers in Turbulence

    Measuring Microfibers in Turbulence

    Microplastic pollution is on the rise, especially in waterways. Microfibers — millimeters in length but only microns in diameter — are especially prevalent, as they get washed out of synthetic clothing. Collecting these pollutants first requires understanding how they move and cluster in turbulent flows. Researchers investigated that using a small water channel and high-resolution cameras.

    The team followed microfiber strands as they moved through turbulence, paying special attention to how the fibers tumbled (rotating about their short axis) and spin (rotating around their long axis). How much fibers tumbled depended on the turbulence level; with more intense turbulence, the fibers tumbled more. Rates of spinning, they found, were consistently even higher than those for tumbling. By better understanding how microfibers behave in turbulence, we’ll be able to, for example, predict how far plastics will travel before settling to the ocean floor. (Image credit: Adobe Stock Photos; research credit: V. Giurgiu et al.; via APS Physics)

  • Origins of Salt Polygons

    Origins of Salt Polygons

    Around the world, dry salt lakes are crisscrossed by thousands of meter-wide salt polygons. Although they resemble crack patterns, these structures are actually the result of convection occurring in the salty groundwater beneath the soil. I have covered the physics previously, but this new article by several of the researchers gives a behind-the-scenes glimpse of the investigation itself and how they uncovered the true explanation. (Image credit: S. Liu, see also: Physics Today)

  • Featured Video Play Icon

    “Echo”

    Daniel Kish is an echolocation pioneer, teaching fellow blind people to navigate the world independently. By clicking or tapping and listening to how the sound reflects back, Kish and his students are able to construct a mental map of the world around them. The technique is so effective that they’re able to ride bikes or, as shown with one student in the documentary, learn to skateboard. Check out the full video to see them in action and get a sense of how echolocation works. (Video and image credit: The New Yorker)

  • Measuring Ocean Upwelling

    Measuring Ocean Upwelling

    Large-scale ocean circulation is critical to our planet’s health and climate. In this process, seawater near the poles cools and sinks into the deep ocean, carrying dissolved carbon and nutrients with it. Later, that cold water gets pushed back up to the surface elsewhere, where it warms, and the cycle repeats. Although the theory behind this circulation has been around for decades, it’s been difficult to observe the rise, or upwelling, of water from the depths. But a recent study used a fluorescent, non-toxic dye to measure upwelling directly.

    Researchers deployed 200 liters of dye just above the floor of a marine canyon near Ireland, then monitored the dye’s movement for several days at a depth of 2200. They found that turbulence along the slope of the canyon drove upwelling at speeds of about 100 meters per day, much faster than global rates. The authors suggest that this kind of topographically-enhanced upwelling could be a major factor in setting overall ocean circulation. (Image credit: visualization – NASA, ship – S. Nguyen; research credit: B. Wynne-Cattanach et al.; via Physics World)

  • Gigantic Jets

    Gigantic Jets

    Stormy skies feature much more than the forked cloud-to-ground lightning we’re used to seeing. This composite image shows a rare and recently-recognized type of lightning known as a gigantic jets. This type of lightning travels from the top of thunderclouds, around 16 km in altitude, up to the ionosphere at about 90 km. Their bottoms look a bit like blue jets, while their upper reaches look like red sprites, two other types of unusual lightning. The mechanism behind gigantic jets is a topic of ongoing research, but your best chance at seeing them is watching a distant thunderstorm from a clear vantage. (Image credit: Li X.; via APOD)

  • Curved Rocks Hit Harder

    Curved Rocks Hit Harder

    Intuition suggests that a flat rock will hit the water with greater force than a spherical one, and experiments uphold that. But a flat rock, interestingly, doesn’t produce the greatest impact force. Instead, it’s a slightly curved rock that experiences peak impact forces. Researchers found this happens because of the thin layer of air that coats the front of the impacting object. For flat faces, this layer is relatively thick and provides a cushioning effect that reduces the peak force and spreads out the impact. In contrast, a slightly curved convex surface traps a thinner air layer, and that lack of cushioning maximizes the impact force. (Image credit: J. Wixom; research credit: J. Belden et al.; via APS Physics)

  • Featured Video Play Icon

    “Plants That Explode”

    We often think of plants as passive and stationary, but the truth is that some plants move faster than we can even see. In this “True Facts” video, Ze Frank takes a look at a whole host of fast-moving plants, including horsetail plant spores that walk and jump, trebuchet-like bunchberry dogwood, vortex-ring-shooting moss, and moisture-driven self-digging seeds. These plants all use clever mechanisms that leverage water to spread the plant’s reproductive material at little to no energy cost to the plant itself. (Video and image credit: Z. Frank)

  • Featured Video Play Icon

    “Black”

    In “Black,” filmmaker Susi Sie combines her visuals of shifting ferrofluids with the music and soundscape of Clemens Haas to create an ominous, almost claustrophobic vibe. With fast cuts and shallow focus, the sharpened points of the normal-field instability appear as flashes of brightness in the dark. At times, the liquid’s surface looks almost like a speaker cone, which is appropriate since ferrofluids are frequently used in speakers to provide cooling and enhance performance. (Video and image credit: Susi Sie)

  • Resolution Effects on Ocean Circulation

    Resolution Effects on Ocean Circulation

    The Gulf Stream current carries warm, salty water from the Gulf of Mexico northeastward. In the North Atlantic, this water cools and sinks and drifts southwestward, emerging centuries later in the Southern Ocean. Known as the Atlantic Meridional Overturning Circulation (AMOC), this circulation is critical, among other things, to Europe’s temperate climate. Since 1995, scientists have been warning that human-driven climate change is weakening the AMOC and may cause it to shut down entirely — which would have catastrophic consequences for our society.

    Comparison of ocean current speeds in the low-resolution (left) and high-resolution (right) simulations.
    Comparison of ocean current speeds in the low-resolution (left) and high-resolution (right) simulations.

    A recent study re-examined the AMOC using both low- and high-resolution numerical simulations, combined with direct observations. Both simulations covered 1950 – 2100 and found the AMOC’s strength has declined since 1950. But the high-resolution simulation found significant regional variations in the AMOC’s behavior. Some regions saw localized strengthening, while other areas showed abrupt collapse. These sensitive shifts underscore the importance of driving toward higher resolutions in our next-generation climate models, if we want to better understand — and perhaps predict — what lies ahead as our climate changes. (Image credit: illustration – Atlantic Oceanographic and Meteorological Laboratory, simulations – R. Gou et al.; research credit: R. Gou et al.; via APS Physics)