Tag: supercomputing

  • Featured Video Play Icon

    Landings Beyond Earth

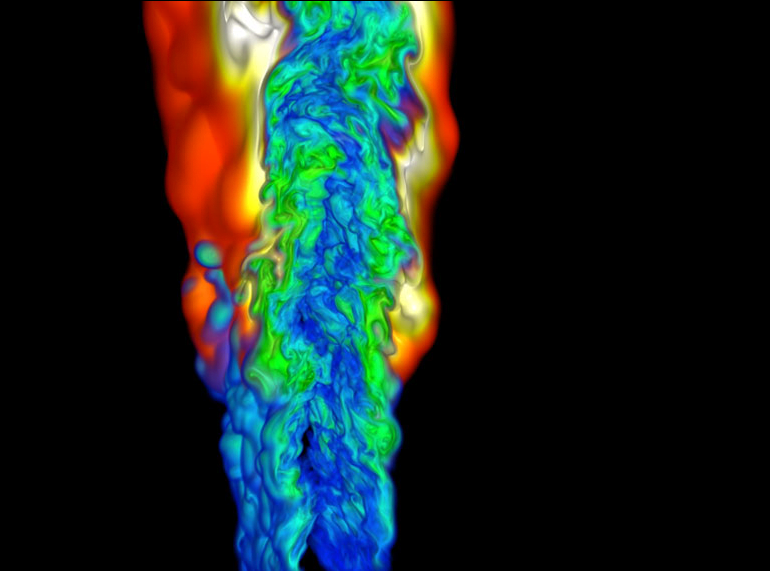
    With planning for manned and unmanned missions to the Moon, Mars, and many asteroids underway, engineers are using numerical simulations to understand how spacecraft thrusters interact with planetary surfaces. Most practical data for this problem comes from the Apollo program and is of limited use for current missions. Recreating a Martian landing on Earth isn’t straightforward, either, given our higher gravity. Thus, supercomputers and numerical simulation are the best available tool for understanding and predicting how the plumes from a spacecraft’s thrusters will interact with a surface and what kind of blowback the spacecraft will need to withstand. (Video credit: U. Michigan Engineering; research credit: Y. Yao et al.; submission by Jesse C.)

  • Simulating Thunderstorms

    Simulating Thunderstorms

    With today’s supercomputing power, it’s possible to simulate entire thunderstorms to study how and why some of them can spawn deadly tornadoes. The animation above comes from a computer simulation of a supercell thunderstorm. The simulation uses initial conditions from a 2011 storm that produced an EF-5 tornado – the highest category of tornado, based on its wind speeds. To see more of the simulation, check out the video below. One thing that might surprise you is just how enormous the towering supercell clouds are compared to the tornado produced in the simulation. Often what we can see of a storm from the ground is only the tiniest part of what goes into producing it. (Image credit: L. Orf et al., source; GIF via @popsci; video credit: UWSSEC)

  • Featured Video Play Icon

    Simulating the Earth

    Computational fluid dynamics and supercomputing are increasingly powerful tools for tracking and understanding the complex dynamics of our planet. The videos above and below are NASA visualizations of carbon dioxide in Earth’s atmosphere over the course of a full year. They are constructed by taking real-world measurements of atmospheric conditions and carbon emissions and feeding them into a computational model that simulates the physics of our planet’s oceans and atmosphere. The result is a visualization of where and how carbon dioxide moves around our planet.

    There are distinctive patterns that emerge in a visualization like this. Because the Northern Hemisphere contains more landmass and more countries emitting carbon, it contains the highest concentrations of carbon dioxide, but winds move those emissions far from their source. As seasons change and plants begin photosynthesizing in the Northern Hemisphere, concentrations of carbon dioxide decrease as plants take it up. When the seasons change again, that carbon is re-released.

    These visualizations underscore the fact that these carbon emissions impact everyone on our planet–nature does not recognize political borders–and so we share a joint responsibility in whatever actions we take. (Video credit: NASA Goddard; h/t to Chris for the second vid)

  • Featured Video Play Icon

    Supersonic Bubble Shock Waves

    Supercomputing has been an enormous boon to fluid dynamics over the past few decades. Many problems, like the interaction between a supersonic shock wave and a bubble, are too complicated for analytical solutions and difficult to measure experimentally. Numerical simulation of the problem, combined with visualization of key variables, adds invaluable understanding. Here a shock wave strikes a helium bubble at Mach 3, and the subsequent interactions in terms of density and vorticity are shown. This situation is relevant to a number of applications, such as supersonic combustion and shockwave lithotripsy–a medical technique in which kidney stones are broken up inside the body using shock waves. After impact, an air jet forms and penetrates the center of the structure while the outer regions mix and form a persistent vortex ring. (Video credit: B. Hejazialhosseini et al.; via Physics Buzz)

  • Supercomputed Fluids

    Supercomputed Fluids

    Computational fluid dynamics and supercomputers can produce some stunning flow visualizations.  Above are examples of turbulence, the Rayleigh-Taylor instability, and the Kelvin-Helmholtz instability. Be sure to check out LCSE’s website for more; they’ve included wallpapers of some of the most spectacular ones. (Photo credits: Laboratory for Computational Science and Engineering, University of Minnesota, #)

  • Formula 1 Aerodynamics

    [original media no longer available]

    Computational fluid dynamics (CFD) and the advent of supercomputing have forever changed the way engineers design. Here the use of CFD in the design of Formula 1 racing cars is discussed. Although CFD is used by many companies in place of wind tunnel testing, each method has its advantages.  CFD provides information about all flow quantities at all points in the flow but can only do so with an accuracy dependent on the grid and models used.  It remains impossible to solve the equations of motion exactly for any problem of practical application because the computational cost is simply too high; instead software packages like FLUENT utilize turbulence models that approximate the physics.  Wind tunnel testing, on the other hand, is physically accurate but typically yields only limited data and flow quantities due to the difficulty of instrumentation. (Video credit: BBC News; submitted by carhogg)

    (Source: /)
  • Featured Video Play Icon

    Sea Surface Temperatures

    This video shows sea surface temperature results and their seasonal variation from a numerical simulation modeling circulation in the atmosphere and oceans. Modeling such enormous problems requires the development of reasonable models of the turbulent physics, clever algorithms to quickly progress the solutions, relatively low-fidelity (a single grid node may cover tens of kilometers), and enormous computing power. (Video credit: NOAA; via Gizmodo)

  • Featured Video Play Icon

    Atomizing Jets

    The breakup of impinging jets into droplets (also called atomization) and the subsequent dynamics of those droplets are important in applications like jet and rocket engines where the mixing of liquid fuel with oxygen is necessary for efficient combustion. This video showcases recent efforts in high fidelity numerical simulation and modeling of such flows. The complexity of the problem requires clever ways of reducing the computational efforts required. One such method uses adaptotive meshing to concentrate grid points in areas where variables are changing quickly while leaving the grid sparse in areas of less interest. Because the flow is constantly evolving, the mesh must be able to adapt as the simulation steps forward in time. Even so, such calculations typically require supercomputers to complete. (Video credit: X. Chen et al)

  • Featured Video Play Icon

    Simulating Turbulence

    Turbulent flows are complicated to simulate because of their many scales. The largest eddies in a flow, where energy is generated, can be of the order of meters, while the smallest scales, where energy is dissipated, are of the order of fractions of a millimeter. In Direct Numerical Simulation (DNS), the exact equations governing the flow are solved at all of those scales for every time step–requiring hundreds or thousands of computational hours on supercomputers to solve even a small domain’s worth of flow, as on the airplane wing in the video. Large Eddy Simulation (LES) is another technique that is less computationally expensive; it calculates the larger scales exactly and models the smaller ones. The video shows just how complicated the flow field can look. The red-orange curls seen in much of the flow are hairpin vortices, named for their shape, and commonly found in turbulent boundary layers.

  • Colorful Computational Combustion

    Colorful Computational Combustion

    Many fluid dynamics problems are so complicated that they require supercomputers to calculate the mathematical and physical details. This image shows a computer simulation of a cold ethylene jet combusting in hot air. Different colors indicate different combustion by-products. Researchers use simulations like this one to investigate ideal flames that improve efficiency in applications like cars or jet engines. #