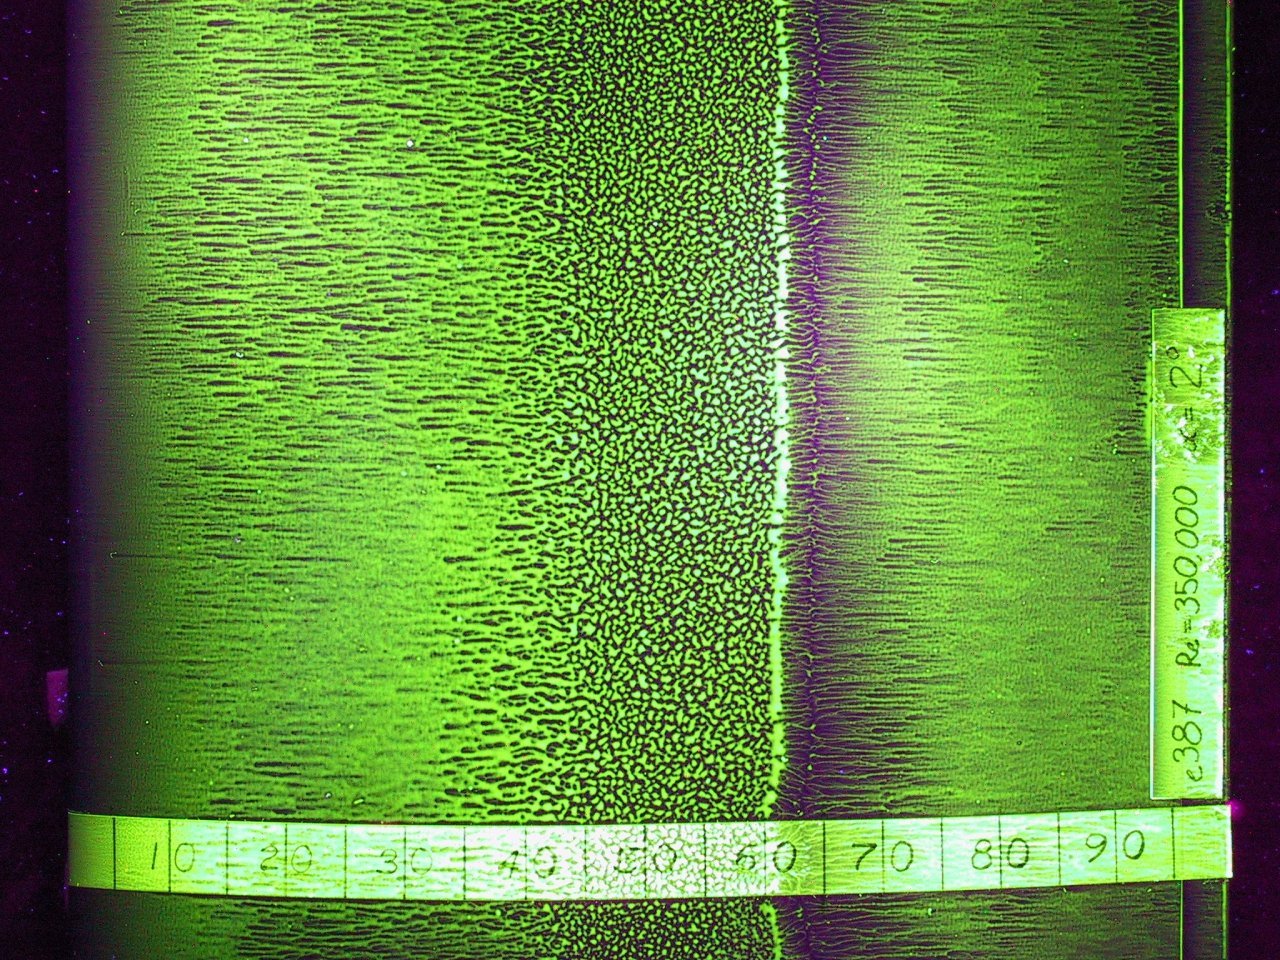
Interest in micro-aerial vehicles (MAVs) has proliferated in the last decade. But making these aircraft fly is more complicated than simply shrinking airplane designs. At smaller sizes and lower speeds, an airplane’s Reynolds number is smaller, too, and it behaves aerodynamically differently. The photo above shows the upper surface of a low Reynolds number airfoil that’s been treated with oil for flow visualization. The flow in the photo is from left to right. On the left side, the air has flowed in a smooth and laminar fashion over the first 35% of the wing, as seen from the long streaks of oil. In the middle, though, the oil is speckled, which indicates that air hasn’t been flowing over it–the flow has separated from the surface, leaving a bubble of slowly recirculating air next to the airfoil. Further to the right, about 65% of the way down the wing, the flow has reattached to the airfoil, driving the oil to either side and creating the dark line seen in the image. Such flow separation and reattachment is common for airfoils at these scales, and the loss of lift (and of control) this sudden change can cause is a major challenge for MAV designers. (Image credit: M. Selig et al.)
Tag: flow visualization

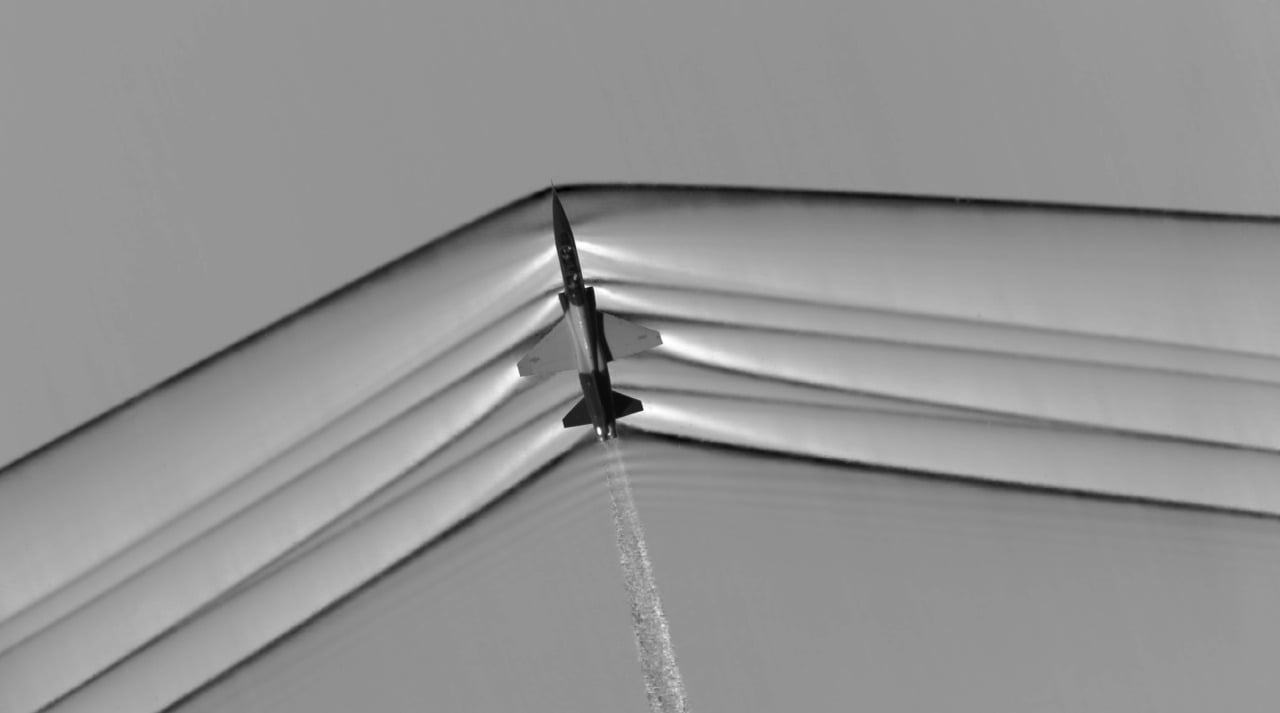
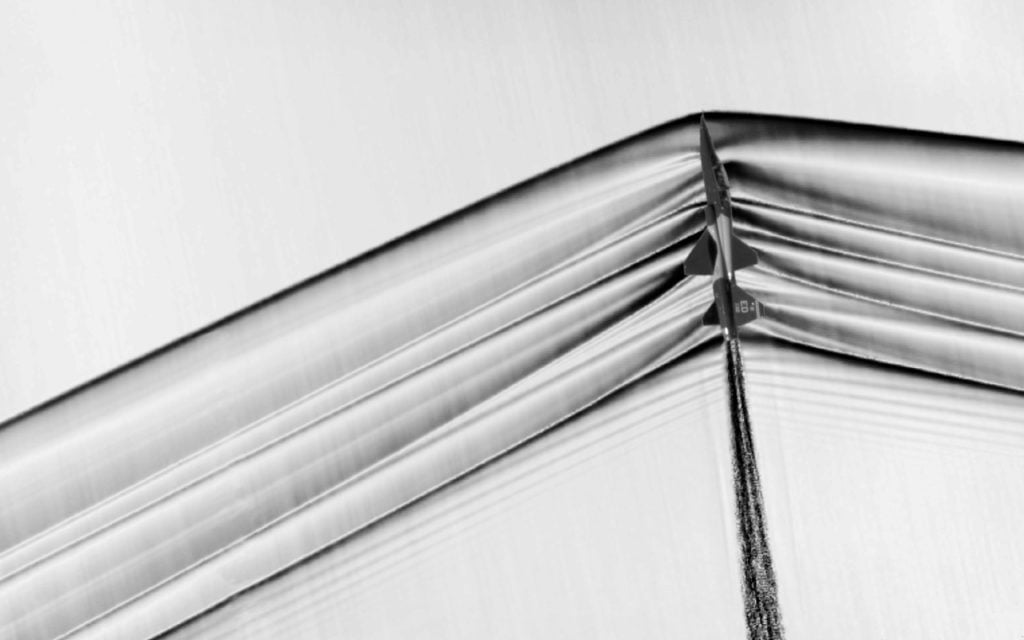
Shock Waves in Flight

Schlieren optical systems have been used to visualize shock waves in labs for more than a century, but the technique did not translate well to photographing shock structures outside the lab. But now NASA’s Armstrong Research Center and Ames Research Center have developed a method that allows them to capture highly-detailed images of the shock waves around airplanes while they are flying. This is incredible stuff. Be sure to check out the high-resolution versions on this page, along with more description of the coordination necessary to pull off the photos.
The light and dark lines you see emanating from the airplane are places with strong density gradients. The dark lines are mostly shock waves, with the strongest shock waves appearing black due to the large change in air density. Many of the light streaks are expansion fans, areas where the density and pressure drop as air speeds up.
The goal of this research is to better understand shock wave structures around supersonic planes in order to reduce the noise supersonic aircraft cause when flying overhead. As you can see in the photos, the shock waves at the nose and tail of the aircraft persist far away from the aircraft; these are what cause the twin sonic boom heard when the plane flies by. (Photo credit: NASA; via J. Hertzberg)

Flow Around a Delta Wing
Colorful streaks of dye wrap like ribbons along the leading edge of a delta wing. At an angle of attack, this triangular wing forms a set of vortices that run along its edge, providing much of the low pressure–and therefore lift–on the upper surface of the wing. In contrast, the red streaks of dye in the middle of the wing demonstrate clean, laminar flow. Highly swept delta wings are popular for aircraft traveling at supersonic speeds, but they can also work well subsonically, as shown here. For more incredible and beautiful examples of flow visualizations by Henri Werlé, check out his 1974 film Courants et couleurs. (Photo credit: H. Werlé; via eFluids)

Convection Cells
This magnified photo shows Rayleigh-Benard convection cells in silicone oil. This buoyancy-driven convection occurs when a fluid is heated from below and cooled above. Inside the cells, fluid rises through the center and sinks along the edges; this motion is made apparent here thanks to aluminum flakes in the oil. The distinctive hexagonal shape of the cells is actually due to surface tension. Here, the upper surface of the fluid is left open to the air and this free surface boundary condition causes hexagonal shapes to form. If the fluid were instead covered by a solid surface, the convection cells that form would be shaped differently. (Image credit: M. Velarde et al.; via Van Dyke’s An Album of Fluid Motion)
——————
LAST CALL: FYFD reader survey closes Wednesday! I’ve teamed up with researcher Paige Brown Jarreau to create a survey of FYFD readers. By participating, you’ll be helping me improve FYFD and contributing to novel academic research on the readers of science blogs. It should only take 10-15 minutes to complete. You can find the survey here.

The Upside-Down Jellyfish
The upside-down jellyfish Cassiopea lives along the sea bottom in coastal regions. As its name suggests, the jellyfish rests upside-down with its bell against the sea floor and its frilly oral arms pointed upward. This jellyfish is a filter feeder, and it draws water up and through its arms by pulsing its bell. The video above visualizes this flow using dye. Each pulse propels fluid up through the arms and draws in fresh water from the surroundings. The frilly arms break up any large vortices from the pulsed flow and diffuse the filtered water as it moves upward. (Video credit: Applied Fluid Mechanics Laboratory at Oklahoma State University)
Convection from a Heat Source
Convection is a major driver in many flows in nature. In this film, the UCLA Spinlab demonstrates buoyant convection caused by a local heat source. They deposit dye on a submerged, continuously heated plate, then observe as the dye slowly rises with the heated (lower density) fluid. The surface forms a cap for the rising dye, which then spreads horizontally. Qualitatively similar flows can be seen in nature over volcanic eruptions or in thunderstorms when clouds reach the troposphere or a capping inversion. Be sure to check out the rest of the Spinlab’s videos. (Video credit: UCLA Spinlab; submitted by Jon B.)

Jumps in Stratified Flows

One of the factors that complicates geophysical flows is that both the atmosphere and the ocean are stratified fluids with many stacked layers of differing densities. These variations in density can generate instabilities, trap rising or sinking fluids, and transmit waves. The animations above show flow over two ridges with dye visualization (top), velocity (middle), and contours of density (bottom). The upstream influence of the left ridge creates a smooth, focused flow that quickly becomes turbulent after the crest. The jet rebounds as a turbulent hydraulic jump before slowing again upstream of the second ridge. Like the first ridge, the second ridge also generates a hydraulic jump on the lee side. Clearly both stratification and the local topography play a big role in how air moves over and between the ridges. If prevailing winds favor these kinds of flows, it can help generate local microclimates. (Image credit and submission: K. Winters, source videos)

3D Printing Fluids
Most flows vary in three spatial dimensions and time. In experimental fluid dynamics, the challenge is measuring as much of this information as possible. For those who use computational fluid dynamics to study flows, their simulations provide massive amounts of data and the challenge comes in visualizing and processing that data in a useful way. Unless you can find and analyze the important aspects of the simulation results, they’re just a bunch of numbers. As computers have advanced, the size and complexity of simulation results has increased, too, making the task even more difficult. Using technologies like virtual reality projections (above) or 3D printing (below) allow researchers to interact with flow information in completely new but intuitive ways, hopefully leading to new insights into the data.
(Video credit: M. Stock; photo credit: K. Taira et al.)
** The 3D-printed vortices are an image I took of a poster at the APS DFD Gallery of Fluid Motion in 2013, but I’m missing the researchers’ names. If you know whose poster these were from, please let me know (fyfluids [at] gmail [dot] com) so that I can update the credits accordingly. Thanks to Shervin for helping me find the right lab to credit!

Laser-Induced Fluorescence
One of the challenges of experimental fluid dynamics is capturing information about a flow that varies in three spatial dimensions and time. Experimentalists have developed many techniques over the years–some qualitative and some quantitative–all of which can only capture a small portion of the flow. The photos above are a series of laser-induced fluorescence (LIF) images of an airfoil at increasing angles of attack. The green swirls are from an added chemical that fluoresces after being excited with a laser. In this case, the technique is providing flow visualization, showing how flow over the upper surface of the airfoil shifts and separates as the angle of attack increases. The technique can also be used, however, to measure velocity, temperature, and chemical concentration. (Image credit: S. Wang et al.)

Soap Film Visualization
Soap films provide a simple and convenient method for flow visualization. Here an allen wrench swept upward through a soap film leaves a distinctive wake. This trail of counter-rotating vortices is known as a von Karman vortex street. Their spacing depends on the wrench’s size and speed. Although the von Karman vortex street is usually associated with the wake of cylinders, it shows up often in nature as well, especially in the clouds trailing rocky islands. (Photo credit: P. Nathan)