Playing with a vortex cannon is a ton of fun, and they are remarkably easy to make. You can knock over cups or card houses, create art, or just try your best Big Bad Wolf impression. Or you can supersize things like one group in the Czech Republic did and build a 3m vortex cannon capable of firing 100m! (Seriously, watch it in action here.) And if you’d like to learn more about how vortex rings form and why they’re useful in nature and engineering, check out my vortex ring video. (Image credit: Laborky Cz, source; via Gizmodo)
Tag: flow visualization

Fog Over Marin
Fog rolls over the hills of Marin County in this long-exposure photograph by Lorenzo Montezemolo. One of the most beautiful aspects of fluid dynamics is the way the same patterns and forms show up across situations. The slow flow of fog over hills in moonlight can echo the blurring speed of rivers pouring over a rocky streambed. Despite the differences in speed, lengthscale, and fluid, the physics remain the same. (Photo credit: L. Montezemolo; via Colossal)

Shear Across the Water
This photo series shows the development of a Kelvin-Helmholtz instability. It’s formed when two layers of fluid move past one another at different speeds. In this case, the two fluids meet off the back of a flat plate (seen at the left of the top image) when fast-moving flow from the top of the plate encounters slower fluid beneath. Friction and shear between the fluid layers causes billows to rise up and form waves very similar to those on the ocean (wind across the water works the same way!). Those waves turn over into vortex-like spirals and keep mixing until they break down into turbulence. This pattern crops up pretty frequently, especially in clouds. (Image credit: G. Lawrence)

“Catacomb of Veils”


Burning Man’s “Catacomb of Veils”, the largest sculpture burned in the 2016 event, produced a series of smoke tornadoes as it blazed. Like dust devils or fire tornadoes, these vortices are driven by hot, buoyant air rising – in this case, from the fire. As the surrounding air moves in toward the fire, any rotational motion, or vorticity, in the air is intensified due to conservation of angular momentum. That concentrates it into a vortex, which becomes visible when it picks up smoke. Simultaneously, the wind was blowing in a consistent direction, sending any new vortices generated marching downstream. You can watch even more vortices and some slow-motion footage of the burning in the full video by Mark Day. (Image credit: M. Day, source; submitted by Larry B)

Bioluminescent Shrimp


Trevor Williams and Jonathan Galione of Tdub Photo captured these beautiful images of bioluminescent shrimp along the Japanese coast. The duo collected the tiny shrimp and poured them over and near rocks to create the effect they wanted. With their blue light, the shrimp act like tracer particles in the water, and with long exposures, the photos track the movements of the shrimp and waves. Technically speaking, they trace out pathlines – the trajectory that a specific fluid (or shrimp) particle takes in a flow. It’s a lovely way of capturing the water’s dynamic motion in a still photo. (Image credit: Tdub Photo; via Colossal)

How Many Licks Does It Take to Get to the Center of a Lollipop?
Many a child has wondered how many licks it takes to get to the center of a lollipop. Physically, this is a problem of a solid body dissolving in a flow, and it’s one scientists are interested in for its geological, industrial, and pharmacological applications.
The animation above shows flow around a dissolving (candy!) body that was originally spherical. With both spheres and cylinders, the final shape the body takes is consistent – it has a front boundary with a curvature of nearly constant radius and a back face that is approximately flat. This creates a boundary layer of uniform thickness across the front face, and that uniform flow makes the surface dissolve steadily and evenly so that it maintains the same overall shape.
With their model and experiments, researchers have even been able to tackle the classic question of how many licks it takes:
“For candy of size 1 cm licked at a speed of 1 cm/s, we estimate a total of 1000 licks, a prediction that is notoriously difficult to test experimentally.”
(Image credit: J. Huang et al., source, pdf)

Capturing SLS


NASA’s recent full-scale ground test of their Space Launch System (SLS) rocket was notable for more than just the engine. It was an opportunity to use a new high dynamic range, high speed camera prototype,
HiDyRS-X, to capture the rocket’s exhaust in detail never seen before. Usually the extreme brightness of the rocket exhaust makes it impossible to see any structure in the flow without completely obscuring the ground equipment. With this camera, however, engineers can see how the engine, exhaust, and surroundings all interact. Be sure to check out the full video. I particularly like watching how the rocket’s exhaust entrains dust and sand from the ground nearby. (Image credit: NASA, source; submitted by Chris P. and Matt S.)

Soap Film Wakes
Soap films can create remarkable flow visualizations when illuminated with monochromatic (single color) light. Each of the photos above shows a flow moving from left to right with a small object near the left creating an obstruction. In the top two images, the objects are cylinders; in the lower one it’s a flat plate tilted at 45 degrees. All of the objects shed vortices as the flow moves past. These vortices alternate in direction – the first spins clockwise, the next counter-clockwise, then clockwise again and so on. This pattern is known as a von Karman vortex street and can even show up in the atmosphere! (Image credit: D. Araya et al.)

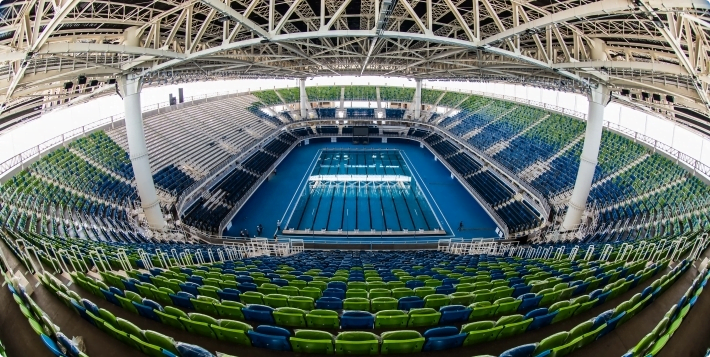
Rio 2016: The Swimming Pool Controversy
Statistical analysis suggests possible current in the Rio Olympics swimming pool
Several news outlets, beginning with The Wall Street Journal, are reporting that the swimming pool in Rio may have had a current that biased athletes’ performances. This is based on a statistical analysis of athlete performances across the meet, conducted by Indiana University’s Joel Stager and his coworkers. According to WSJ, Stager et al. analyzed times of athletes in the preliminary, semifinal, and final races of the 50m, 800m, and 1500m events and found consistent evidence that swimmers in the higher numbered lanes swam faster when moving toward the starting block and swimmers in the lower numbered lanes swam faster when moving toward the turn end of the pool. A separate analysis by Barry Revzin at Swim Swam came to similar conclusions about the direction and magnitude of lane effect in Rio.
Past questions about lane bias
This is not the first time questions have been raised about a current-induced bias in competition pools. In fact, Stager and his colleagues published an analysis in 2014 that suggested a similar bias in the pool used for the 2013 World Championships in Barcelona. That pool was a temporary pool built specifically for the competition by Myrtha Pools and was disassembled immediately after, before Stager et al.’s analysis was published.
A more recent paper by Stager and his colleagues found that lane bias seems to be more prevalent in temporary pools than in permanent ones. The Rio Olympics pool, like the 2013 Worlds pool, is a temporary pool also built by Myrtha Pools.
Myrtha Pools responds to the criticism
Myrtha responded to both WSJ and Swim Swam by sharing videos (1, 2) of their current test, which was conducted before the competition and on Day 3 of competition. The videos show a floating object in one of the outside lanes; neither video shows any noticeable movement of the object.
Fluid dynamics and swimming pool design
Competitive swimming pools are complicated recirculating systems that can contain special structures intended to minimize interactions between competitors. Myrtha has built many special event pools in recent years, including ones where the results did not show a bias. According to their website, Myrtha has fluid dynamicists on staff and uses computational fluid dynamics (CFD) to analyze pool performance during design, although they only show examples of freeform pools – not competition pools.
In fact, I have found remarkably few CFD analyses of swimming pools in the literature. Most papers seem to focus on distribution of disinfectants in pools or in predicting evaporation rates – both practical problems but ones with limited relevance to this particular question.
So, is there a current in the Rio pool?
It’s tough to say with certainty that there is a current in Rio’s pool. The performance analyses by Stager et al. and by Revzin do show anomalies in the times of athletes in Rio based on their swim lane, and they show that those anomalies do not exist in many other recent competitions.
I also do not think Myrtha’s current test constitutes evidence of a lack of current. Their floating object is only indicative of conditions at the air-water interface. Swimmers ride lower in the water and spend significant time completely underwater. Lane markers may also damp any flow effects near the surface.
I think introducing dye underwater in the pool would do more to reveal any flow that may exist, and this would be a worthwhile test to conduct prior to the deconstruction of the Rio Olympic pool. Additionally, it would be wonderful to see a CFD analysis of the swimming pool, but this would require significant detail about the pool’s design (inlet and outlet locations, etc.) some of which is likely proprietary information.
Neither dye visualization nor CFD simulation will change the results of this competition, but it may help reveal underlying issues in temporary pool designs so that any bias can be avoided in future competitions.
(Image credit: Rio City Government)
Special thanks to @MicahJGreen for bringing this story to my attention and to Dave B. for his assistance.

Rio 2016: Sailing and Rule 42


If you watch some of the sailing in Rio, you may hear commentators mention sailors being penalized for breaking Rule 42. Broadly speaking, Rule 42 says that sailors can’t use their body to propel the boat. While it seems like a little rocking couldn’t make much difference, it turns out events have these rules for good reason.
One way to break Rule 42 is to perform sail flicking, demonstrated in the animation above. The sailor uses his or her body weight to roll the boat slightly, which causes the sail to flick. Aerodynamically speaking, we’d call this motion heaving. On the flexible sail, this unsteady motion decreases drag, allowing the boat to go faster. Done with the right frequency and amplitude, sail flicking actually makes the sail’s drag become negative, thereby creating thrust!
The bottom image shows a visualization of the wake of a normal sail (left) and a sail being flicked (right). Both sails shed vortices in the downstream direction, but the flicked sail has much stronger vortices, indicated by the darker colors. In addition to giving a sailor an illegal boost, sail flicking creates more difficult, turbulent conditions for any competitors downstream, so it’s restricted in many (but not all) sailing events. (Image credits: AP Photos; Reuters; National Solo, source; research and flow diagram credit: R. Schutt and C. Williamson, pdf)
Join us throughout the Rio Olympics for more fluid dynamics in sports. If you love FYFD, please help support the site!