Tag: experimental fluid dynamics

  • Featured Video Play Icon

    Driving Instabilities with a Twist

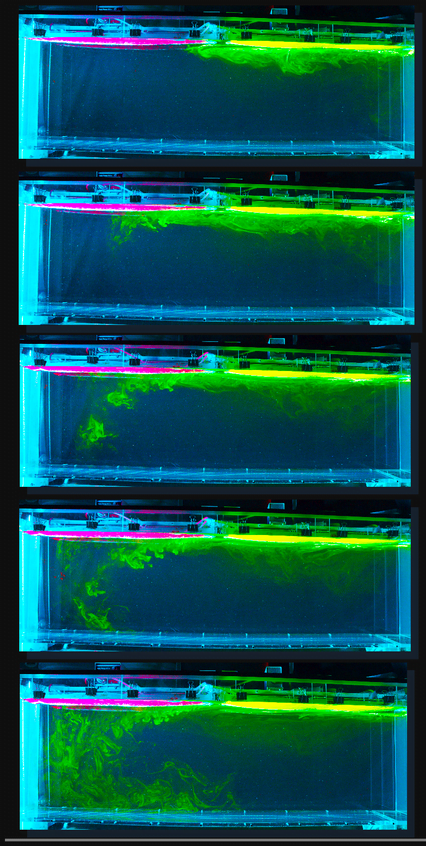
    Imagine that you want to study how two fluids mix when a lighter fluid is pushed into a denser one. Conceptually, it’s a straightforward situation. It would be like having a layer of oil under a layer of water and watching what happens. But how do you do that experimentally? Oil won’t naturally stay under water. If you flip the container over to start the experiment, you’ve added a bunch of extra motion from the rotation. And if you use a barrier to separate the two layers and then pull it out, you’ve added extra shear where they meet.

    To deal with challenges like these, researchers at Lehigh University spent five years designing and building the rotating wheel apparatus you see in the video above. Instead of relying on gravity to force the lighter fluid into a denser one, this set-up uses centrifugal force. The test fluids start out on the loading wheel, spinning in their naturally stable configuration. Then once both sides are rotating at the desired speed, the track flips, transferring the experiment onto the other wheel, which rotates in the opposite sense. This gives the fluids a sudden change in the direction of the centrifugal force and, once the apparatus completes shake-down, should give us new insight into the sort of mixing seen in fusion. (Video credit: Lehigh University; see also Turbulent Flow Design Group)

  • Featured Video Play Icon

    Calimero’s Uprising!

    Here on FYFD posts often focus on research results, with animations and images showing only a tiny portion of the apparatus necessary to conduct that work. But in this timelapse, we get to see a glimpse of what it takes to make the research happen. The video covers a 12-week period in which student Sietze Oostveen sets up, modifies, and takes measurements with a rotating tank apparatus called Calimero. 

    The video captions give you a sense of all the little tasks that go into experimental work, from installing thermal control and measurement systems (in this case, laser Doppler velocimetry, or LDV) to making sure that the rotating table is balanced correctly. In experimental work, it’s worth remembering that you’ll likely spend as much or more time preparing to take data than you will actually doing measurements! (Video credit: S. Oostveen/UCLA Spinlab)

  • Astrophysical Turbulence

    Astrophysical Turbulence

    Subsonic turbulence – like the random and chaotic motions of air and water in our everyday lives – is something we have only a limited understanding of. Our knowledge of supersonic turbulence, where shock waves and compressibility rule, is even more tenuous. In part this is because, although we can observe snapshots of supersonic turbulence in astronomical settings like the Orion Nebula shown above, we cannot watch it evolve. On these scales, features simply don’t change appreciably on human timescales.

    This has limited scientists to mostly numerical and theoretical studies of supersonic turbulence, but that is starting to change. Researchers are now building experimental set-ups that collide laser-driven plasma jets to generate boundary-free turbulence at Mach 6. Thus far, the observations are consistent with what’s been seen in nature: at low speeds, the turbulence is consistent with Kolmogorov’s theories, with energy cascading from large scales to smaller ones predictably. But as the Mach number increases, the nature of the turbulence shifts, moving toward the large density fluctuations seen in nebulae and other astrophysical realms. (Image credit: F. Battistella; research credit: T. White et al.; see also Nature Astronomy; submitted by Kam-Yung Soh)

  • Featured Video Play Icon

    Mimicking Hurricanes

    Hurricanes are a frequent and potentially deadly occurrence for many parts of the world. Although forecasting models have improved, there is still a lot about the physics of these storms that we don’t fully understand, in part because getting direct measurements from the real thing is so difficult and hazardous. Researchers at the University of Miami have instead built their own hurricane generator, capable of sustained 200 mph winds – strong enough to create Category 5 hurricane conditions. In this facility, they can study details of the storm up close, allowing them to distinguish effects from the scale of large waves down to the physics of the sea spray. Learn more and see the facility in action in the Science Friday video below. (Video credit: L. Groskin/Science Friday; image credits: L. Groskin/Science Friday, University of Miami, SUSTAIN Lab; submitted by Guillaume D.)

  • Mixing Fresh and Salty

    Mixing Fresh and Salty

    Earth’s oceans are a complex and dynamic environment, but fortunately, we can simulate some of their physics on a smaller scale in the laboratory. The time series of images above show how fresh and salty waters mix. On the right side of the image is fresh water with its top layer dyed green. On the left is salty water dyed pink. Initially, the fresh water spreads horizontally toward the salty region in a smooth and laminar fashion. As the fresh water picks up salt, it gets denser and starts sinking, ultimately forming a turbulent plume that will push all the way back across the tank. For more images, check out the full poster. (Image credit: P. Passaggia et al.)

  • Featured Video Play Icon

    Researching Wind Turbines

    Two of the most awesome things (in my admittedly biased opinion) about fluid dynamics are the amazing facilities we build for experiments and the tests they allow us to do. In this video, you get a behind-the-scenes look at one such facility, used for wind turbine research at Princeton.

    One challenge of wind turbine research is accurately capturing the aerodynamic effects of full-scale wind turbines in the controlled-environment of a laboratory. At Princeton, they match conditions between their model turbines and the real ones by drastically raising the density in their wind tunnel. This means that running the tunnel requires a series of compressors and storage tanks full of compressed air, and it also means that the wind tunnel itself has to be quite hefty to handle the pressure difference inside and out. Definitely check out the full video for more on their wind tunnel and what it can help them learn about wind turbines. (Video credit: M. Miller and J. Keifer; submitted by M. Miller)

  • Featured Video Play Icon

    Quantum Droplets

    Over the past decade, fluid dynamicists have been investigating tiny droplets bouncing on a vibrating fluid. This seemingly simple experiment has remarkable depth, including the ability to recreate quantum behaviors in a classical system. In this video, some of the researchers demonstrate their experimental techniques, including how they vary the frame rate relative to the bouncing of the drops. At the right frame rate, this sampling makes the droplets appear to glide along with their ripples, giving us a look at a system that is simultaneously a particle (drop) and wave (ripple). (Video credit: D. Harris et al.)

  • Rio 2016: Whitewater Sports

    Rio 2016: Whitewater Sports

    The whitewater rapids of canoe slalom have their origins in mountain streams. Today the sport’s Olympic venues are artificial rivers, specially designed to provide world-class rapids whatever the geography of the host city. Rio’s course, like London’s, is reconfigurable; its features are controlled by the placement of Lego-like plastic blocks.

    A key part of the course’s design process was building a small-scale physical model of the course. To maintain the dynamics of the rapids at a smaller physical scale, engineers used a concept called similitude. Surface waves like rapids are a function of the flow’s inertia and the effects of gravity, a ratio that’s captured in the dimensionless Froude number. To match the small-scale model to the real flow, engineers scaled the features of the real course down such that the Froude number stayed the same between the model and the full-scale course. As seen in the animations above, this meant that the model had the same general flow features as the final course, letting engineers and designers test and fine-tune features before construction. Learn more about the model and its construction in these two videos. (Image credits: kayaker – Getty Images; model comparisons – J. Pollert, source)

    Previously: Physics of rowingwhy that octopus kite looks so real

    Join us throughout the Rio Olympics for more fluid dynamics in sports. If you love FYFD, please help support the site!

  • Why Does This Kite Look So Real?

    Why Does This Kite Look So Real?

    A recent viral video features mesmerizing footage of a giant octopus kite flown at a kite festival in Singapore earlier this month. The kite’s arms twist and wave lazily in the breeze. Watching the video, I was struck by how realistic the kite’s motion looks. It really looks like an octopus is just cruising there in mid-air. And that resemblance might not be accidental.

    In fluid dynamics, scientists often use a concept called dynamic similitude to test the physics of a scale model instead of the full-size original. The simplest version of this uses the Reynolds number to compare the model and the original. The Reynolds number is a dimensionless number that depends on the object’s size, the flow’s speed, and the density and viscosity of the fluid. If you match the scale model’s Reynolds number to the original’s Reynolds number, then the physics will be the same – even if you changed the fluid or the size of the object.

    Returning to our kite, one thing the footage doesn’t entirely convey is just how enormous this kite really is. The Straits Times reports the kite is about the length of five buses and requires six people to get aloft. But the kite’s size helps compensate for the fact that it’s flying in air instead of swimming through viscous water like a real octopus. Although I’m left estimating the kite’s size and the wind’s speed, my quick calculations put the Reynolds numbers for the kite and the octopus on the order of 10,000. So, strange as it seems, this giant kite really is acting like a swimming octopus!

    (Image credits: E. Chew, source)

  • Eulerian vs. Lagrangian

    Eulerian vs. Lagrangian

    When I first studied fluid dynamics, one of the concepts I struggled with was that of Eulerian and Lagrangian reference frames. Essentially, these are just two different perspectives you can view the fluid from.  Physics is the same in both, but mathematically, you approach them differently. In the Eulerian perspective one sits at a location and watches the flow pass, like an observer watching a river go by. It’s demonstrated in the top animation, where turbulent flow sweeps past in a pipe. This is the usual perspective experimentally – you put an instrument at a certain point in the flow and you gather information as the fluid streams past in time.

    In the Lagrangian perspective, on the other hand, one follows a particular bit of fluid around and observes its changes over time. This means that one has to follow along at the mean speed of the flow in order to keep up with the fluid parcel one is observing. It would be like running alongside a river so that you can always be watching the same water as it flows downstream. The Lagrangian view of the same turbulent pipe flow is shown in the bottom animation. Notice how moving alongside the pipe makes it easier to see how the turbulence morphs as it goes along. Experimentally, this can be harder to achieve (at least in a flow with non-zero mean speed), but it’s a useful method of studying unsteadiness. (Image credit: J. Kühnen et al., source)