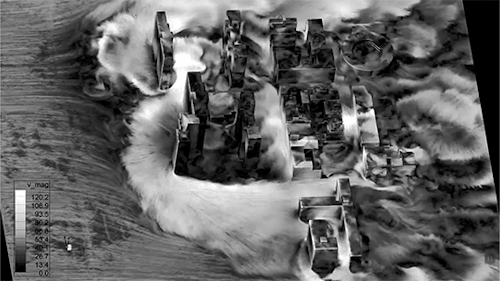
Tag: computational fluid dynamics

  • Prehistoric Filter Feeders

    Prehistoric Filter Feeders

    Earth’s earlier ages are filled with enduring mysteries about the plants and creatures that lived and died long before humanity. Many of these organisms, like the aquatic Ernietta shown above, are known only from scattered fossil remains. Yet fluid dynamics is helping us understand how Ernietta lived and fed some 545 million years ago.

    Ernietta were sack-like organisms consisting of stitched-together tubular elements. They had no way to move around and no obvious method for transporting nutrients into their bodies. Scientists hypothesized that they likely used one of two feeding methods: either Ernietta relied on its surface area to extract nutrients directly from the water or its shape enabled it to trap larger particles to feed on from the flow. To decide between these modes, scientists turned to computational fluid dynamics.

    By modelling both single Ernietta and small groups, they found that the shape of the organism generates a rotating current inside the bag that pulls flow down along one side and back up the other. Moreover, being near one another enhanced this effect, helping downstream Ernietta catch more particles than they otherwise would. All in all, the results suggest not only Ernietta’s likely feeding method but also that they lived in colonies and practiced one of the earliest known examples of communal feeding! (Image credit: D. Mazierski, source; research credit: B. Gibson et al.; via ArsTechnica; submitted by Kam-Yung Soh)

  • Urban Centers During Hurricanes

    Urban Centers During Hurricanes

    As the climate warms, many urban centers are facing stronger and more frequent storms. Some, like New York City, are using numerical simulations to better understand the interactions of their complicated urban geometries with hurricane force winds. 

    Above you see a simulation showing predicted wind speeds in a Lower Eastside neighborhood. The incoming wind speed (from the left) is roughly 60 m/s (~134 mph), but the speeds around and between buildings are as much as 2 times higher than that. That means that, even if a storm is Category 3 or 4, there will be areas of a neighborhood that receive sustained winds well beyond the range of a Category 5 hurricane. Urban planners need this sort of data both for devising building requirements and for understanding what storm conditions warrant mandatory evacuations for residents. (Video and image credit: X. Jiang et al.)

  • Featured Video Play Icon

    Breaking

    As waves fold over and break, they trap air, creating bubbles of many sizes. The smallest of these bubbles can be only a few microns across and persist for long times compared to larger bubbles. When they burst, they create tiny droplets that can carry sea salt up into the atmosphere to seed rain. Understanding how these bubbles form and how many there are of a given size is key to predicting both oceanic and atmospheric behaviors. Numerical simulations like the one featured in the video above reveal the dynamic collisions that create these tiny bubbles and help researchers learn how to model the tiniest bubbles so that future simulations can be faster. (Image and video credit: W. Chan et al.)

  • Flow in the Heart

    Flow in the Heart

    Few flows are more integral to our well-being than blood flow through the heart. Over the course of our lives, our hearts develop from a few cells pushing viscous blood through tiny arteries to the muscular center of a vast circulatory network, capable of powering us through incredible physical feats. What’s most astonishing about all this is that the heart goes through all these changes and adaptations without ever pausing. 

    Peering into the heart to see it in action is difficult, but researchers today are combining imaging techniques like CT and MRI with computational fluid dynamics to build patient-specific heart models. Not only does this help us understand hearts in general; it’s paving the way toward predicting how a specific treatment may affect a patient. Imagine, for example, being able to simulate and compare different models of an artificial heart valve to see which will work best for a particular patient. We’re not to the point of doing so yet, but it’s a very real possibility in the future. 

    To see some examples of predicted and measured heart flows, check out this video by J. Lantz. In the meantime, happy Valentine’s Day! (Image credits: Linköping University Cardiovascular Magnetic Resonance Group, video source; via Another Fine Mesh)

  • Inside a Heart

    Inside a Heart

    You may not give it much thought, but there is important fluid dynamics happening inside you every moment of every day, especially inside your heart. Of the four chambers of the heart, the left ventricle has the thickest walls, reflecting its important task: pumping oxygenated blood throughout the body. In a healthy heart (top of poster; click here for the full-size version), a vortex ring and trailing jet fill the ventricle when the mitral valve opens. Then the ventricle contracts and pumps blood out the aortic valve and into the rest of the body.

    But for individuals with a leaking aortic valve (bottom of poster), things look different. Blood leaks back through the aortic valve at the same time that the mitral valve opens to allow freshly oxygenated blood back in. The two inflows disrupt mixing in the chamber, and, instead of pumping fully-oxygenated blood into the body, the left ventricle has to struggle to pump a less-oxygenated mixture into the body. (Image credit: G. Di Labbio et al.)

    ETA: (Research paper: G. Di Labbio et al., arXiv)

  • What Makes Turbulence So Hard

    What Makes Turbulence So Hard

    Turbulence – that pestersome, unpredictable, and chaotic state of flow – has been a thorn in the sides of mathematicians, physicists, and engineers for centuries. It is certainly one of – if not the – oldest unsolved problem in physics. Over at Ars Technica, Lee Phillips has a nice overview of the situation, including what makes the problem so difficult:

    The Navier-Stokes equation is difficult to solve because it is nonlinear. This word is thrown around quite a bit, but here it means something specific. You can build up a complicated solution to a linear equation by adding up many simple solutions. An example you may be aware of is sound: the equation for sound waves is linear, so you can build up a complex sound by adding together many simple sounds of different frequencies (“harmonics”). Elementary quantum mechanics is also linear; the Schrödinger equation allows you to add together solutions to find a new solution.

    But fluid dynamics doesn’t work this way: the nonlinearity of the Navier-Stokes equation means that you can’t build solutions by adding together simpler solutions. This is part of the reason that Heisenberg’s mathematical genius, which served him so well in helping to invent quantum mechanics, was put to such a severe test when it came to turbulence. 

    Phillips goes on to describe some of the many methods researchers use to unravel the mysteries of turbulence computationally, experimentally, and theoretically. This is a great introduction for those curious to get a sense of how turbulence, stability theory, and computational fluid dynamics all fit together. (Image credits: L. Da Vinci; NASA; see also: Ars Technica; submitted by Kam Yung-Soh)

  • The Protection of the Peloton

    The Protection of the Peloton

    It’s well-known by professional cyclists that sitting in the middle of the peloton requires little effort to overcome aerodynamic drag, but now, for the first time, there’s a scientific study to back that up. Researchers built their own quarter-scale peloton of 121 riders to investigate the aerodynamic effect of cycling in such a large group versus riding solo. Through wind tunnel studies and numerical simulation, they found that riders deep in the peloton can experience as little as 5-10% of the aerodynamic drag of a solo cyclist. 

    Tactically, this means teams should aim to position their protected leader or sprinter mid-way in the pack, where they’ll receive lots of shelter without risking one of the crashes common near the back of the peloton. It also suggests that teams wanting to isolate another team’s leader should try to push them toward the outer edges of the peloton rather than letting them sit in the middle. It will be interesting to see whether pro teams shift their race strategies at all with these numbers in hand.

    Of course, this study considers only a pure headwind. But other groups are looking at the effects of side winds on cyclists. (Image credit: J. Miranda; image and research credit: B. Blocken et al.; submitted by 1307phaezr)

  • Featured Video Play Icon

    Swimming, Cycling, and Sailing

    Summer brings with it lots of great sports, and whether you love riding a bike, sailing a boat, or just hanging out at the pool, our latest FYFD/JFM video has something for you. Want even more sports physics? Check out the Olympic series we did for the London and Rio games. And if you’re looking for more of the latest fluids research, don’t miss the rest of our video series. (Video and image credit: N. Sharp and T. Crawford)

  • Breaking With a Wave

    Breaking With a Wave

    For rocket combustion and other applications, like watering your lawn with a hose, a stream of fluid may need to be broken up into droplets. While simply spraying a liquid jet will make it break up, waving that jet back and forth will break it up faster. A recent study simulated this problem numerically to determine the exact mechanisms driving that break-up. The researchers found two major culprits.

    The first is a Kelvin-Helmholtz, or shear-based, instability. When a jet leaves the nozzle, there’s friction between it and the comparatively still air surrounding it. This creates tiny ripples in the surface that eventually grow into the distortions we can see, and it’s found in all jets, regardless of their side-to-side motion.

    The second culprit, which is only found in the oscillating jet, is a Rayleigh-Taylor instability. By moving the jet side-to-side, you’re driving the dense liquid into less dense air, which creates a different set of disturbances that also help break up the jet. The final result: swinging the jet side-to-side breaks it into smaller droplets faster. (Image and research credit: S. Schmidt et al.)

  • Forming Europa’s Bands

    Forming Europa’s Bands

    Jupiter’s icy moons, Europa and Ganymede, are home to subsurface oceans. These moons also experience strong tidal forces from their parent planet and sibling moons that squeeze and deform them over time. A new study focuses on the bands, seen in red in the top image of Europa, that form as a result of these deformations. By simulating (bottom image) both the convective currents within the Europan ocean and the deformation of the ice over time, scientists are able to study how these geological surface features may have formed. Over the course of about a million years, material from the interior ocean works its way up into the center of a band. Because this process takes so long, the researchers point out that any attempt to collect material from the bands will yield “fossil” ocean material – essentially a glimpse of Europa’s ocean as it existed a million years ago rather than how it exists today! (Image credit: NASA; image and research credit: S. Howell and R. Pappalardo, source; submitted by Kam-Yung Soh)