Tag: blood

  • Sorting Blood Cells

    Sorting Blood Cells

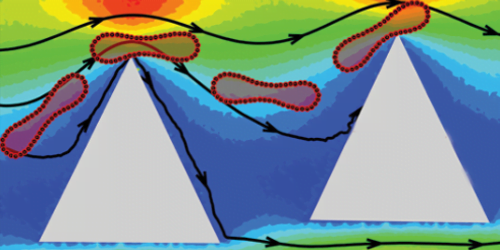
    Many diseases – like sickle-cell anemia and malaria – are accompanied by changes in the stiffness of red blood cells. And while microfluidic devices capable of sorting blood cells by size exist, few have made microfluidic devices capable of sorting blood cells by their deformability. But a new set of simulations suggests we could do so relatively easily.

    Existing devices sort blood cells by size using an array of tiny posts – kind of like a cellular pachinko machine. Through simulation, researchers found that by changing the shape of these posts – specifically by turning them from circles into sharper triangles –  they could sort the red blood cells by their stiffness. Because the sharp corners create large local stresses in the fluid, the blood cells get deformed when passing the corner. That ends up deflecting stiffer cells into a different stream. Build a whole array of posts and you can sort the blood cells by their degree of stiffness – ideally allowing you to isolate the most diseased cells. (Image and research credit: Z. Zhang et al.; via APS Physics)

    ETA: Added a clarification: some researchers, like Beech et al., have investigated deformability-based sorting devices.

  • Flow in the Heart

    Flow in the Heart

    Few flows are more integral to our well-being than blood flow through the heart. Over the course of our lives, our hearts develop from a few cells pushing viscous blood through tiny arteries to the muscular center of a vast circulatory network, capable of powering us through incredible physical feats. What’s most astonishing about all this is that the heart goes through all these changes and adaptations without ever pausing. 

    Peering into the heart to see it in action is difficult, but researchers today are combining imaging techniques like CT and MRI with computational fluid dynamics to build patient-specific heart models. Not only does this help us understand hearts in general; it’s paving the way toward predicting how a specific treatment may affect a patient. Imagine, for example, being able to simulate and compare different models of an artificial heart valve to see which will work best for a particular patient. We’re not to the point of doing so yet, but it’s a very real possibility in the future. 

    To see some examples of predicted and measured heart flows, check out this video by J. Lantz. In the meantime, happy Valentine’s Day! (Image credits: Linköping University Cardiovascular Magnetic Resonance Group, video source; via Another Fine Mesh)

  • Flow Inside the Heart

    Flow Inside the Heart

    Inside each of us is a remarkable and constant flow, driven by a muscle that’s always at work. As blood circulates through our bodies, it goes through a surprisingly varied journey. In the heart, as seen above, blood flow is very unsteady and quite turbulent, due to the beating pulse of the heart. As valves open and close and the muscle walls constrict and relax, the rushing blood moves in eddy-filled spurts. In the outer reaches of our capillaries, however, the nature of the flow is quite different. Thanks to smaller vessel sizes and other factors, capillary blood flow is much steadier and more laminar. Viscosity becomes more important, as do the non-Newtonian properties of components in our blood. (Image credit: mushin111/YouTube, source; via Science; submitted by Gary N.)

  • Gunshot Back-Splatter

    Gunshot Back-Splatter

    Today blood pattern analysis is an important forensic technique used in reconstructing the events at crime scenes. Many methods use straight-line trajectories to try to isolate the origin of blood splatters, but this discounts the effects of gravity and drag on flying droplets. A new theory models the back-splatter of a gunshot wound fluid dynamically.

    Using characteristics of the bullet and gunshot, it estimates the initial conditions of blood drops leaving a wound, then models the break-up of the fluid as a Rayleigh-Taylor instability, where a denser fluid (blood) is accelerating into a less dense fluid (air). This results in a moving cloud of droplets and air whose trajectory and impact on a surface can be calculated. The ultimate goal is to create a physical model that can be used in reverse, where analysts can observe patterns and calculate their origin with confidence. For more, see the original paper or Gizmodo’s coverage. (Image credit: T. Webster; research credit: P. Comiskey et al.)

  • Drying Blood Can Reveal Anemia

    Drying Blood Can Reveal Anemia

    Blood is a remarkably complicated fluid, thanks in part to its many constituents. What we see here is an animation of a drop of blood evaporating at several times normal speed. As water from the blood evaporates, it causes relative changes in surface tension. These surface tension gradients cause convection inside the drop and carry red blood cells toward the outer portion of the drop. As the blood evaporates further, it leaves behind different patterns that depend on which parts of the whole blood mixture were deposited in each region. Interestingly, the final desiccation patterns can indicate the healthiness of a patient. Below are images of dried blood patterns from (left) a healthy individual and (right) an anemic individual. (Image credits: D. Brutin et. al., source)

    image

    Special thanks to our Patreon patrons, who help keep FYFD bringing you daily doses of fluid dynamics.

  • Featured Video Play Icon

    Blood Flow Simulations

    Though we may not often consider it, our bodies are full of fluid dynamics. Blood flow is a prime example, and, in this video, researchers describe their simulations of flow through the left side of the heart. Beginning with 3D medical imaging of a patient’s heart, they construct a computational domain – a meshed virtual heart that imitates the shape and movements of the real heart. Then, after solving the governing equations with an additional model for turbulence, the researchers can observe flow inside a beating heart. Each cycle consists of two phases. In the first, oxygenated blood fills the ventricle from the atrium. This injection of fresh blood generates a vortex ring. Near the end of this phase, the blood mixes strongly and appears to be mildly turbulent. In the second phase, the ventricle contracts, ejecting the blood out into the body and drawing freshly oxygenated blood into the atrium. (Video credit: C. Chnafa et al.)