Tag: atmospheric science

  • Hole Punch Clouds

    Hole Punch Clouds

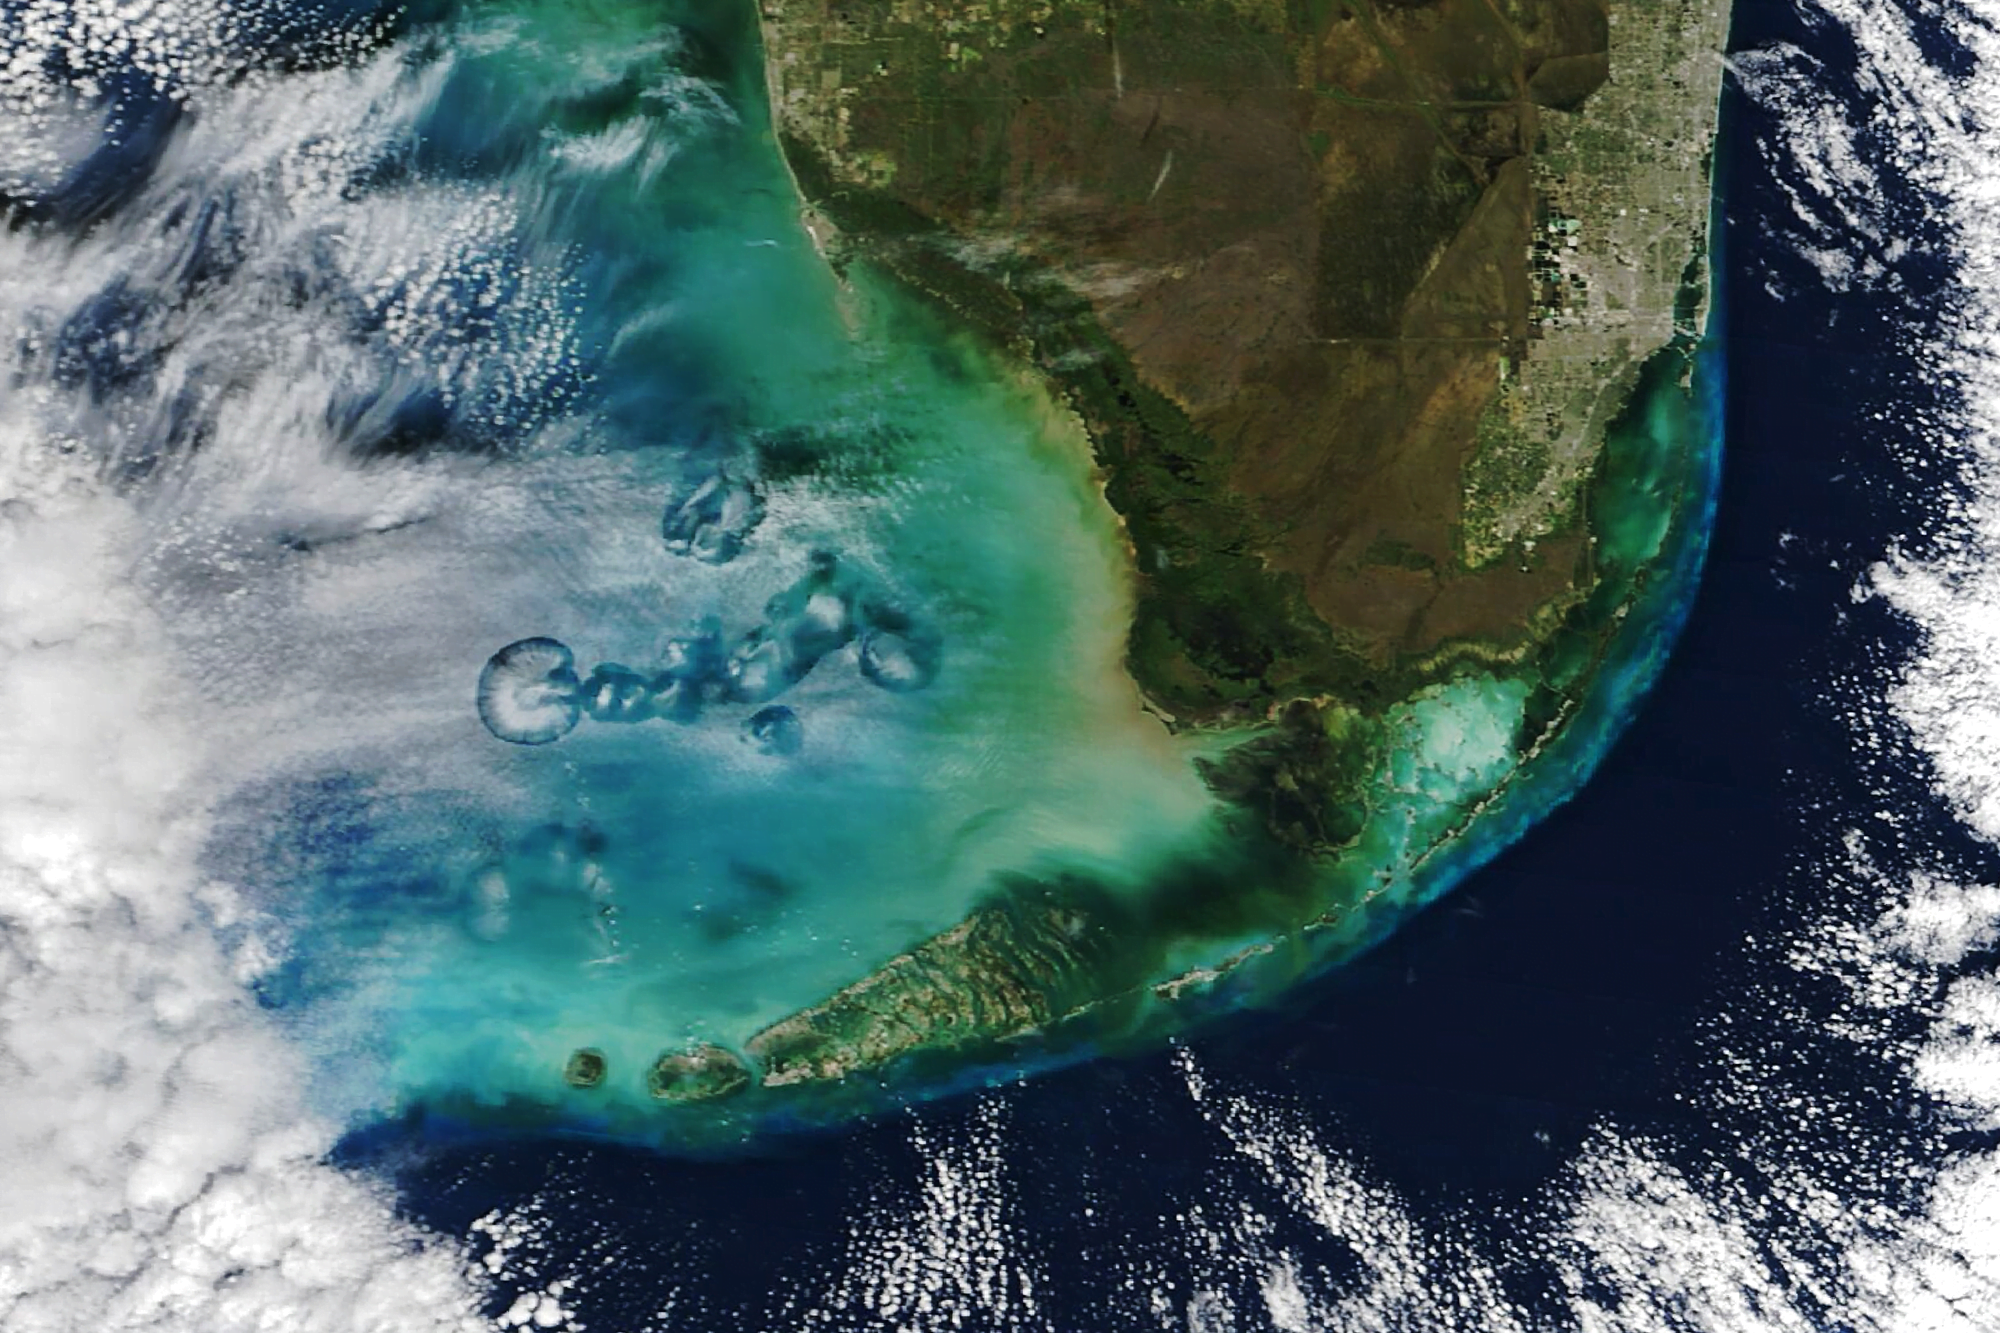
    At times altocumulus cloud cover is pierced by circular or elongated holes, filled only with the wispiest of virga. These odd holes are known by many names: cavum, fallstreak holes, and hole punch clouds. Long-running debates about these clouds’ origins were put to rest some 14 years ago, after scientists showed they were triggered by airplanes passing through layers of supercooled droplets.

    When supercooled, water droplets hang in the air without freezing, even though they are colder than the freezing point. This typically happens when the water is too pure to provide the specks of dust or biomass needed to form the nucleus of an ice crystal. But when an airplane passes through, the air accelerated over its wings gets even colder, dropping the temperature another 20 degrees Celsius. That is cold enough that, even without a nucleus, water drops will freeze. More and more ice crystals will form, until they grow heavy enough to fall, leaving behind a clear hole or wisps of falling precipitation.

    In the satellite image above, flights moving in and out of Miami International Airport have left a variety of holes in the cloud cover each of them large enough to see from space! (Image credit: M. Garrison; research credit: A. Heymsfield et al. 2010 and A. Heymsfield et al. 2011; via NASA Earth Observatory)

  • The Real Butterfly Effect

    The Real Butterfly Effect

    The butterfly effect — that the flapping of a butterfly’s wings in Brazil can cause a tornado in Texas — expresses the sensitivity of a chaotic system to initial conditions. In essence, because we can’t possibly track every butterfly in Brazil, we’ll never perfectly predict tornadoes in Texas, even if the equations behind our weather forecast are deterministic.

    But this interpretation doesn’t fully capture the subtleties of the situation. With fluid dynamics, the small scales of a flow — like the turbulence in an individual cloud — are linked to the largest scales in the flow — for example, a hurricane. For short times, we’re actually quite good at predicting those large scales; our weather forecasts can distinguish sunny days and cloudy ones a week out. But at smaller scales, the forecast errors pile up quickly. No one can forecast that an individual cloud will form over your house three days from now. And because the small scales are linked to the larger scales, the uncertainties from the small scale cascade upward, limiting how far into the future we can reliably predict the weather.

    And, unfortunately, drilling down to capture smaller and smaller scales in our models can’t fix the problem, unless our initial uncertainties are identically zero. To get around this problem, weather forecasters instead use ensemble forecasting, where they run many simulations of the weather with slightly different initial conditions. Those differences in initial conditions let the forecasters play with those initial uncertainties — how accurate is the temperature reading from that station? How reliable is the instrument reporting that humidity? How old is the satellite data coming in? Once all the forecasts are run, they can see how many predicted sunny days versus rainy ones, which ones resulted in severe weather, and so on. Often the probabilities we see in our weather app — like 30% chance of rain — depend on factors including how many of the forecasts resulted in rain.

    Unfortunately, this butterfly effect permanently limits just how far into the future we can predict weather — at least until we fully understand the nature of the Navier-Stokes equations. For much more on this interesting aspect of chaos, check out this Physics Today article. (Image credit: NASA; see also T. Palmer at Physics Today)

    Fediverse Reactions
  • Warming Temperatures Increase Turbulence

    Warming Temperatures Increase Turbulence

    After multiple high-profile injuries caused by atmospheric turbulence, you might be wondering whether airplane rides are getting rougher. Unfortunately, the answer is yes, at least for clear-air (i.e., non-storm-related) turbulence in the North Atlantic region. It seems that climate change, as predicted, is increasing the bumpiness of our atmosphere. There are a couple of mechanisms at play here.

    The first is that warming temperatures fuel thunderstorms. When ground-level temperatures and water temperatures are warmer, that provides more warm, moist air rising up and feeding atmospheric convection. Especially in the summertime, that translates into stronger, more frequent thunderstorms; even with flights avoiding the storms themselves, there’s greater turbulence surrounding them.

    The second mechanism relates to wind, specifically in the mid-latitudes. In general, a temperature difference between two regions causes stronger winds. (Think about the windy conditions that accompany an incoming cold front.) At the mid-latitudes, the difference between cold polar regions and warmer equatorial ones creates a strong wind, known as the jet stream. Now, as temperature gradients increase at cruising altitudes, the jet stream gets stronger, which means bigger changes in wind speed with altitude. And its those wind speed differences at different heights that drive turbulence.

    So, yes, we’re likely to see more turbulent flights now and in the future. But, fortunately, there’s a simple way to avoid injuries from that bumpiness: buckle up! If you keep your seat belt fastened while you’re seated, you can avoid getting tossed around by unexpected G-forces. (Image credit: G. Ruballo; see also Gizmodo)

  • How Venus Is Losing Its Water

    How Venus Is Losing Its Water

    Since Venus formed at the same time as Earth and is similar in size, scientists believe it once had the same amount of water our planet does. Today, hellish Venus has hardly any water, a fact scientists have struggled to explain completely. Most of its water was lost long ago, as incoming particles from the solar wind stripped water from the upper atmosphere; unlike Earth, Venus doesn’t enjoy the protection of a magnetic field.

    But that mechanism doesn’t explain just how arid Venus is now. A new study instead suggests that Venus’s water loss is ongoing, driven by simple chemical reactions. The team found that molecules of HCO+ (an ion made from one hydrogen, one carbon, and one oxygen atom) could mix with any remaining water to form a positively-charged molecule. Due to that charge, the chemical easily attracts loose electrons. Once combined, however, the resulting molecule is too energetic and breaks apart; when it does so, it releases highly-energetic hydrogen, which escapes the atmosphere into space. Without that hydrogen, water molecules can’t reform. This process of dissociative recombination could explain why the rest of Venus’s water has disappeared.

    Science missions that have flown to Venus so far haven’t been equipped to measure HCO+, and the authors recommend this as a priority for future missions to our neighbor. With that data, we could confirm or disprove this mechanism for Venusian water loss. (Image credit: NASA; research credit: M. Chaffin et al.; via Gizmodo)

  • Exoplanet Heating

    Exoplanet Heating

    WASP-96B is a tidally-locked exoplanet between the size of Saturn and Jupiter. This hot, massive planet lies close to its star, orbiting in less than three-and-a-half Earth days. A recent study shows that planets like these can have very different weather, depending on what depth their atmosphere absorbs heat at.

    Using numerical simulations, researchers took a detailed look at the possible atmospheric dynamics on this planet. When the atmosphere absorbed heat at a shallow depth — near the outer layers of the planet — a coupled vortex pair formed (left, below). These vortices promenaded westward and completed a circuit around the planet every 11-15 days.

    Shallow heating on a hot Jupiter produces a pair of coupled vortices (left), but deeper heating in the atmosphere generates four more-chaotic vortices (right).
    Shallow heating on a hot Jupiter produces a pair of coupled vortices (left), but deeper heating in the atmosphere generates four more-chaotic vortices (right).

    In contrast, deeper heating produced a more-chaotic pattern of four vortices (right, above) that each lasted 3 to 15 days before disappearing, replaced by a new vortex. This atmosphere, they found, was very turbulent, with smaller-scale vortices as well.

    Since each weather pattern is visually distinct and carries its own brightness signature, the authors predict that additional observations of WASP-96b with the current generation of telescopes will show which type of heating dominates on the exoplanet. (Image and research credit: J. Skinner et al.; via APS Physics)

    Snapshots from a simulation of a deep-heated hot Jupiter. Each image shows the planet on a different day.
    Snapshots from a simulation of a deep-heated hot Jupiter. Each image shows the planet on a different consecutive day.
  • Red Sprites

    Red Sprites

    Sprites, or red sprites, are high-altitude electrical discharges in the atmosphere. Although sometimes called upper-atmospheric lightning, sprites are a cold plasma phenomenon. They often occur in clusters, as in this photo by Angel An, which won in the Skyscapes category of the 2023 Astronomy Photographer of the Year competition. Sprites, which last only a millisecond or so, take place during intense thunderstorms, but, unlike our more familiar lightning, sprites move upward from the storm toward the ionosphere. They can occur on Venus, Saturn, and Jupiter as well, although sprites have only been observed directly on Earth and Jupiter. (Image credit: A. An; via Colossal)

  • Dust Storms

    Dust Storms

    Hot, dry berg winds swept down from the Namibian highlands and sent these plumes of dust flying out to the Atlantic coast. Another plume — white instead of brown — marks salt dust from the Etosha Pan salt flat. The dust and salt become aerosol particles in the atmosphere — seeds for raindrops to form. Coastal towns sometimes need construction equipment to deal with the drifting sand from these storms, but these storms are small compared to Saharan dust storms. Those storms are so large that their dust influences the weather on the other side of the Atlantic. (Image credit: W. Liang; via NASA Earth Observatory)

  • Rolling Over Wisconsin

    Rolling Over Wisconsin

    Although they may look sinister, roll clouds like this one are no tornado. These unusual clouds form near advancing cold fronts when downdrafts cause warm, moist air to rise, cool below the dew point, and condense into a cloud. Air in the cloud can circulate around its long horizontal axis, but the clouds won’t transform into a tornado. Roll clouds are also known as Morning Glory clouds because they often form early in the day along the Queensland coast, where springtime breezes off the water promote their growth. The clouds do form elsewhere, though; this example is from Wisconsin in 2007. (Image credit: M. Hanrahan; via APOD)

  • Clouds Down Under

    Clouds Down Under

    This large and unusual cloud formation was captured one July morning over western Australia. Stretching over 1,000 kilometers, the clouds have interesting features at both the large and small scale. The small-scale ripples within the clouds are gravity waves triggered by the terrain below. The larger, arced features are tougher to explain, though they may also be related to gravity waves and terrain, just on a much larger scale. They also resemble fallstreak clouds where supercooled droplets evaporate from the inside of the cloud out. (Image credit: W. Liang; via NASA Earth Observatory)

  • Featured Video Play Icon

    “Vorticity 5”

    Photographer and stormchaser extraordinaire Mike Olbinski is back with the fifth volume in his “Vorticity” series. Shot over the 2022 and 2023 tornado seasons in the U.S. Central Plains, this edition has virtually everything: supercells, microbursts, lightning, tornadoes, and haboobs. There’s towering convection and churning, swirling turbulence. It’s a spectacular look at the power and grandeur of our atmosphere. (Video and image credit: M. Olbinski)