Reader junolivi asks:
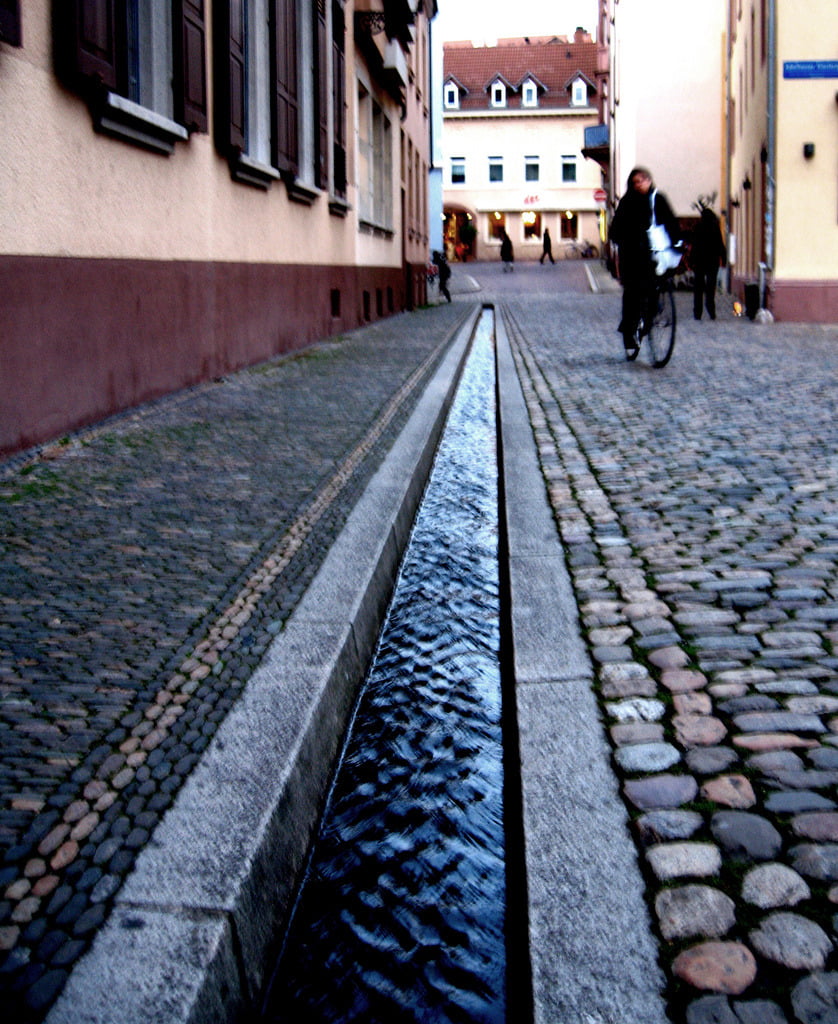
When shallow water (like runoff from melting snow) flows across pavement, it creates small repeated wave-like ripples. What creates that texture and why isn’t it just a steady flow?
This is a great question that’s probably crossed the mind of anyone who’s seen water running down the gutter of a street after a storm. The short answer is that this gravity-driven flow is becoming unstable.
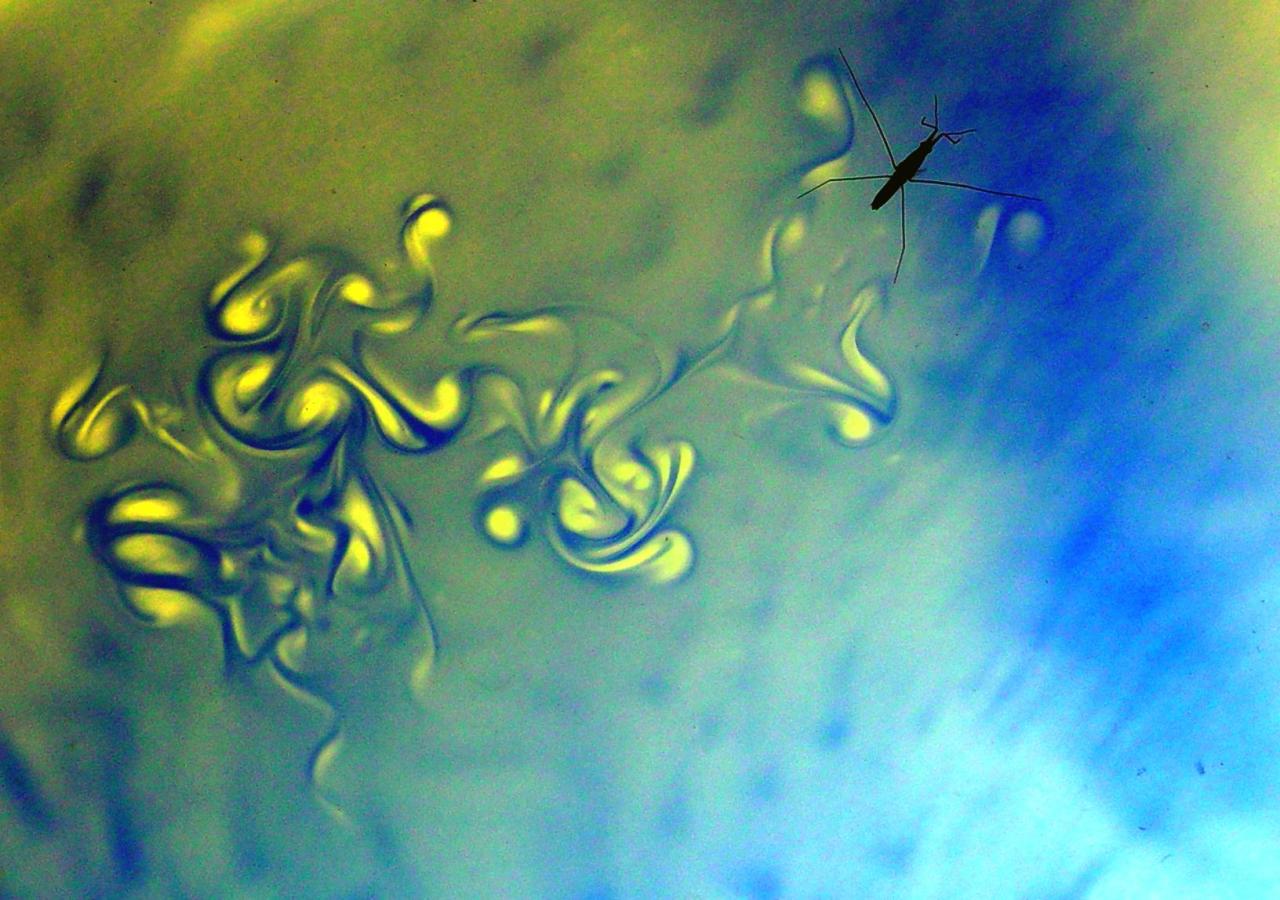
Fluid dynamicists often like to characterize flows into two main types: laminar and turbulent. Most flows in nature are turbulent, like the wild swirls you see behind cars driving in the rain. But there are laminar flows in nature as well. Often flows that begin as laminar will become turbulent. This happens because those laminar flows are unstable to disturbances.
The classic example of stability is a ball on a hill. If the ball is at the top of the hill and you disturb it, it will roll down the hill because its original position was unstable. If, on the other hand, the ball is in a depression, then you can prod the ball and it will eventually settle back down into its original place because that position was stable. Another way of looking at it is that, in the unstable case, the disturbance–how far the ball is from its original position–grows uncontrollably. In the stable case, on the other hand, the disturbance can be initially large but eventually decays away to nothing.
There are many ways to disturb a laminar flow–surface roughness, vibrations, curvature, noise, etc., etc. These disturbances enter the flow and they can either grow (and become unstable) or decay (because the flow is stable to the disturbance). Just as one can look at the stability of a pendulum, one can mathematically examine the stability of a fluid flow. When one does this for water flowing down an incline, one finds that the flow is quite unstable, even in the ideal case of a pure, inviscid fluid flowing down a smooth wall.
The reason that one sees distinctive waves with a particular wavelength (assuming that they aren’t caused by local obstructions) is directly related to this idea of instability. Essentially, the waves are the disturbance, having grown large enough to see. One could imagine that any wavelength disturbance is possible in a flow, but mathematically, what one finds, is that different wavelengths have different growth rates associated with them. The wavelength we observe is the most unstable wavelength in the flow. This is the wavelength that grows so much quicker than the others that it just overwhelms them and trips the flow to turbulence. This is very common. For example, you can see distinctive waves showing up before the flow goes turbulent in both this mixing layer simulation and this boundary layer flow.
(Image credits: anataman, mo_cosmo; also special thanks to Garth G. who originally asked a similar question via email)