
In a new ad campaign for paint manufacturer Sherwin-Williams, the production team at Psyop show off some awesome fluid dynamics by swirling and injecting paint underwater. You can see one sequence above, where red and blue paint vortex rings collide head-on before breaking down into a purple turbulent cloud. (What a great way to demonstrate the mixing power of turbulence, right?) Here’s the full 30-second ad clip. Impressively, everything in the video is a practical effect, even the segment that flies past multicolored turbulent plumes. You can see how they filmed everything in their behind-the-scenes featurette below. In the meantime, enjoy the mesmerizing beauty of real-world physics and check out FYFD’s “fluids as art” tag for more examples. (Image and video credit: Psyop for Sherwin-Williams; submitted by Alan B.)
Search results for: “turbulence”

Bottle Rocket Shock Diamonds
Mach diamonds or shock diamonds can often be seen in the exhaust of rocket engines. Here they’re shown in high-speed video of a bottle rocket’s launch. The rocket’s exhaust exits at a pressure that is higher than the surrounding atmosphere, which causes the exhaust to bulge outward and forms two expansion fans, seen in pink, to lower the pressure. The pressure actually drops too low, however, causing shock waves, seen in turquoise, to form in order to raise the exhaust’s pressure. This back-and-forth between shock waves and expansion fans continues, forming the diamond shapes we see. Each subsequent set gets weaker as the exhaust closes in on the right pressure, and ultimately the series of diamonds fades into turbulence. (Image credit: P. Peterson and P. Taylor, source)

Vortex Impact

When a vortex ring impacts a solid wall (or a mirrored vortex ring), it expands and quickly breaks up. The animations above show something a little different: what happens when a vortex ring hits a water-air interface. As seen in the side view (top image), the vortex starts to expand, but its shear at the interface generates a stream of smaller vortices that disrupt the larger vortex. (They even look like a little string of Kelvin-Helmholtz vortices!) When viewed from above (bottom image), the vortex ring impact and breakdown look even more complicated. Mushroom-like structures get spat out the sides as those secondary vortices form, and the entire structure quickly breaks up into utter turbulence. There’s some remarkable visual similarities between this situation and some we’ve seen before, like a sphere meeting a wall and drop hitting a pool. (Image credit: A. Benusiglio et al., source)
Creating Clouds
What you see here is the formation of clouds and rain – but it’s not quite what you’re used to seeing outside. This is an experiment using a mixture of sulfur hexafluoride and helium to create clouds in a laboratory. Everything is contained in a cell between two transparent plates. Liquid sulfur hexafluoride takes up about half of the cell, and when the lower plate is heated, that liquid begins evaporating and rising in the bright regions. When it reaches the cooled top plate, the liquid condenses into droplets inside the dimples on the plate, eventually growing large enough to fall back as rain. The dark wisps you see are areas where cold sulfur hexafluoride is sinking, much like in the water clouds we are used to. Setups like this one allow scientists to study the effects of turbulence on cloud physics and the formation of droplets. (Image credit: E. Bodenschatz et al., source)
Boston-area folks! I’ll be taking part in the Improbable Research show Saturday evening at 8 pm at the Sheraton Boston. Come hear about the Boston Molasses Flood and other bizarre research!

“Pulse”
Photographer Mike Olbinski returns with another incredible storm-chasing timelapse video, this time all in black-and-white. To me, that choice helps “Pulse” emphasize the ominous majesty of these supercells and tornadoes by highlighting the textures that make up the clouds. Watching clouds in timelapse, they seem to materialize from nowhere as moisture drawn up from the land cools and condenses. Sped up, suddenly the convective rotation and the roiling turbulence inside clouds is perfectly clear. I especially love the sequence beginning at 2:25, where a distant black line slowly transforms into an incredible landscape marked with successive waves of rolling, turbulent clouds. Watch this one on a large screen at a high resolution, if you can. You won’t regret it! (Video credit: M. Olbinski)

Jovian Poles


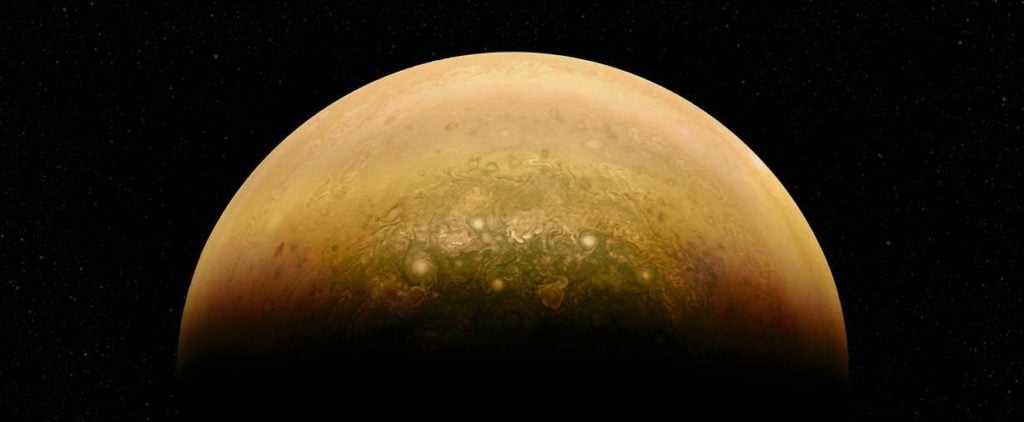


NASA’s Juno mission has been revealing a side of Jupiter we’ve never seen before. We all recognize the familiar stripes of the planet’s cloud bands, but its poles are entirely different. Unlike Saturn with its hexagonal polar vortex, Jupiter’s poles are a swirling tapestry of turbulent vortices – full of features that citizen scientists are helping to reveal. All of the images in this post were created by citizen scientists helping to process raw images from Juno, and you can contribute, too! The Juno mission solicits input from the public on where and what should be imaged, in addition to providing raw images individuals can process and repost. Check it out at the JunoCam website and become part of the science! (Image credits: All images – NASA/SwRI/MSSS + R. Tkachenko, Orion76; A. Mai)

Shear Across the Water
This photo series shows the development of a Kelvin-Helmholtz instability. It’s formed when two layers of fluid move past one another at different speeds. In this case, the two fluids meet off the back of a flat plate (seen at the left of the top image) when fast-moving flow from the top of the plate encounters slower fluid beneath. Friction and shear between the fluid layers causes billows to rise up and form waves very similar to those on the ocean (wind across the water works the same way!). Those waves turn over into vortex-like spirals and keep mixing until they break down into turbulence. This pattern crops up pretty frequently, especially in clouds. (Image credit: G. Lawrence)

Where Jupiter’s Heat Comes From
Exactly what goes on in Jupiter’s atmosphere has confounded scientists for decades. Its upper atmosphere – essentially the only part we can observe – is hundreds of degrees warmer than solar heating can account for. Although it has bright auroras at its poles, that energy is trapped at high altitudes by the same rotational effects that create Jupiter’s stunning bands.
Observations of Jupiter’s Great Red Spot, a storm that’s lasted for hundreds of years, may provide clues as to where all the extra heat is coming from. Spectral mapping shows that the area over the Spot is over 1000K warmer than the rest of the upper atmosphere. Because of its isolated location, the best explanation for the Great Red Spot’s extra heat comes from below: scientists suspect that the raging storm is generating so much turbulence and such a deafening roar that these gravity and acoustic waves propagate upward and heat the atmosphere above. If so, a similar coupling mechanism to the clouds below may account for the widespread warmth in Jupiter’s upper atmosphere. (Image credit: NASA; research credit: J. O’Donoghue et al.)
Flamethrowing
Humans have long been fascinated by staring into flames, and the Slow Mo Guys carry on the grand tradition here with 4K, high-speed video of a flamethrower. Like firebreathers, a flamethrower’s fire is the result of a spray of tiny, volatile droplets of fuel. Once ignited, the spray becomes a turbulent jet of flames. Turbulent flows are known for having both large and small-scale structure, and there’s some really great close-ups showing this around the 2:00 mark. Also watch the edges of the flame, where the nearby air has gotten hot enough to shimmer. You can see how the trees in the background ripple and blur as the fire heats up the air and changes its density and refractive index. (Video credit: The Slow Mo Guys)

Visualizing Smell
Every day we’re surrounded by an invisible world of smells. Like the fluorescein dye in the animation above, these odors drift and swirl in the background flow. What you may not have stopped to consider when you smell the roses, though, is how the very act of sniffing changes the scent. When you inhale, filaments of the odor are drawn into your nose, and, likewise, when you exhale, your breathe mixes with the scent and sends it swirling outward in turbulent eddies. To see more about the science of scent, check out PBS News Hour’s full video below. (Video credit: PBS News Hour; GIF via skunkbear)