


 gorbax asks:
 I’ve been wondering for a while, actually, how do we know when the method of flow visualization doesn’t actually alter the flow of a fluid itself?
This is a great question and one that fluid dynamicists have to deal with all the time. Ideally, we’d love to measure everything we want from a flow at all points at all times without doing anything to affect it. In reality, however, that just doesn’t happen. Some measurement techniques are less intrusive than others, but just about everything risks having some effect. This raises two questions: 1) How small can we make that effect? and 2) Do we even care if we’re affecting the flow?
With regards to the first, the onus is typically on the experimentalist to show that whatever visualization technique he/she uses is not significantly affecting the flow. For something like particle image velocimetry, which requires seeding the flow with particles, this means selecting particles that follow the flow rather than changing it and considering carefully how and where to seed the flow such that any added vorticity from the injection does not alter the flow significantly. Checking for this can be done many ways, for example with comparisons to other measurement techniques (with and without seeding) or by comparing to simulation.
The second question–do we care?–is also a significant consideration. Because the purpose of flow visualization is often to get a qualitative feel for the flow field rather than quantitative information, it is often not a significant concern if there is some slight effect from the visualization technique. This can often be the case with smoke-wire and dye visualizations where we just want to see what’s going on.
Finally, there are some instances of flow visualization which are completely unobtrusive to the flow. Schlieren photography and infrared thermography are two examples. Both are optical techniques that act from a distance and take advantage of extant flow properties to make certain features visible. The real key is knowing what technique(s) will work for the flow you have and will give you the information you want. After that, it’s all about proper and thorough execution. (Photo credits: N. Vandenberge et al., T. Omer, M. Canals, P. Danehy et al., A. Wilkens et al., W. Saric et al.)

Visualization Via Temperature
One downside to many flow visualization techniques, like those using dye, smoke, or particles, is the difficulty of dealing with their aftermath. You can only introduce so much of them into a wind or water tunnel before it’s necessary to shutdown and clean everything. One alternative is to use temperature, as shown in the video above. By simply introducing a warmer fluid and using an IR camera, it’s possible to accomplish many of the same effects without the mess. (Video credit: A. Khandekar and J. Jacob; submitted by J. Jacob)

Visualizing F-18 Flow
Flow visualization techniques are helpful outside of wind and water tunnels, too. The photo above comes from the F-18 High Alpha Research Vehicle (HARV) program in which techniques like smoke and dye visualization were used in-flight to visualize airflow around an F-18 at large angles of attack. During flight a glycol-based liquid dye was released from tiny holes along the plane’s forebody, creating the pattern seen here later on the ground. This particular test corresponded to about 26 degrees angle of attack. (Photo credit: NASA Dryden)
“Levitating Water”
Al Seckel, a cognitive neuroscientist and expert on illusions, created this “Levitating Water” installation, in which multiple streams of water appear as a series of levitating droplets thanks to a strobing light. The well-timed strobe lighting tricks the brain into seeing many different falling droplets as the same, nearly stationary droplet. The effect is similar to the one created by vibrating a stream of falling water. (Video credit: wunhanglo)
Droplet Bounce
This high-speed video shows the remarkable resilience of a water droplet upon impact against as a solid surface. The droplet deforms into a pancake-shape, with its center depressing almost flat before rebounding upward. The rest of the drop follows, splitting into several droplets as capillary waves dance across its surface. When one satellite drop almost escapes, the main droplet just barely comes in contact with it, the coalescence enough to tip surface tension into pulling them together instead of breaking them apart. (Video credit: K. Suh/ChemistryWorldUK)
The Kelvin-Helmholtz Instability in the Lab
Though often spotted in water waves or clouds, the Kelvin-Helmholtz instability is easily demonstrated in the lab as well. Here a tank with two layers of liquid – fresh water on top and denser blue-dyed saltwater on the bottom – is used to generate the instability. When level, the two layers are stationary and stable due to their stratification. Upon tilting, the denser blue liquid sinks to the lower end of the tank while the freshwater shifts upward. When the relative velocity of these two fluids reaches a critical point, their interface becomes unstable, forming the distinctive wave crests that tumble over to mix the two layers. (Video credit: M. Stuart)
Bubble Lenses
In this video, artist Jesse Zanzinger experiments with the lens-like refractive properties of bubbles. Though focused on the bending of light, there’s plenty here in terms of coalescence, surface tension, and miscibility. He has a similar video that includes a shot of his set-up here. (Video credit: J. Zanzinger)
Fluids Round-up – 25 May 2013
Sometimes I come across cool links and stories about fluid dynamics that don’t quite fit into a typical FYFD post, but I’d like to start sharing those semi-regularly with round-up posts. Here’s some fun stuff I’ve seen lately:
- We’ve talked before about penguins and fluid dynamics, but this IOP talk from Helen Czerski is a great take on how they use fluids to escape predators.
- Over at FlowViz, Richard has a great video demonstrating deep versus shallow water waves side-by-side.
- io9 shows off the vibrational modes of mercury as well as explaining why birds can be good at flying or swimming but not both.
- Giant paint explosions (specifically here) may be fun to watch but the dangers are not for squeamish viewers.
- Dylan G sent us this 512K real-time fluid particle simulation that’s a fun distraction.
- xckd’s Randall Munroe answers all kinds of physics questions at his What If? blog, but occasionally there are some fluids ones. Two of my favorites consider a hypersonic steak and what happens if the glass is literally half full.
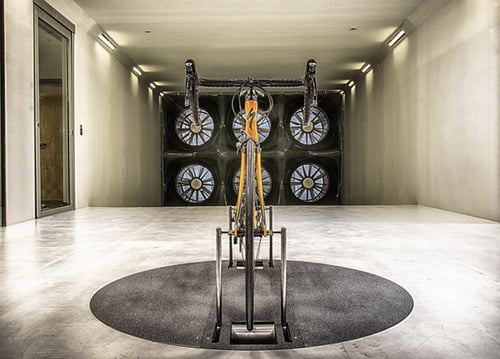
- Finally, for the cyclists and triathletes among you, the recent news that bicycle manufacturer Specialized has built its own wind tunnel has generated lots of discussion of aerodynamics in sport. Mark Cote (@MITAeroBike) and Chris Yu (@chrisyuinc) of Specialized’s aero R&D have been answering questions on Slowtwitch, Twitter, and in live chats.
And, yes, that last Specialized video chat includes an FYFD shout-out about 49 minutes in. 🙂
(Photo credit: Specialized)

Turbulence and Magnetic Field Lines
During a solar flare, magnetic field lines on the sun are often visible due to the flow of plasma–charged particles–along the lines. According to theory, these magnetic lines should remain intact, but they are sometimes observed breaking and reconnecting with other lines. An interdisciplinary team of researchers suggests that turbulence may be the missing link. In their magnetohydrodynamic simulation, they found that the presence of chaotic turbulent motions made the magnetic line motion entirely unpredictable, whereas laminar flows behaved according to conventional flux-freezing theory. (Photo credit: NASA SDO; Research credit: G. Eyink et al.; via SpaceRef; submitted by jshoer)
Effects of Hills on Flow
Hills and other topology can have interesting and complex effects on a flowfield. With the FAITH experiment, NASA has been investigating an axisymmetric model hill using a combination of experimental methods. The video above shows flow visualization over the hill in a water channel using dye injection both upstream and downstream of the model. They’ve also done wind tunnel tests with oil-flow visualization, particle-image velocimetry, pressure sensitive paint and other measurement techniques. There are nice photos of some of these by Rob Bulmahn. By combining qualitative and quantitative flow measurement techniques, the researchers are able to capture many different aspects of the flow, which can then be shared and compared with other groups’ works. (Video credit: NASA Ames Research Center)