
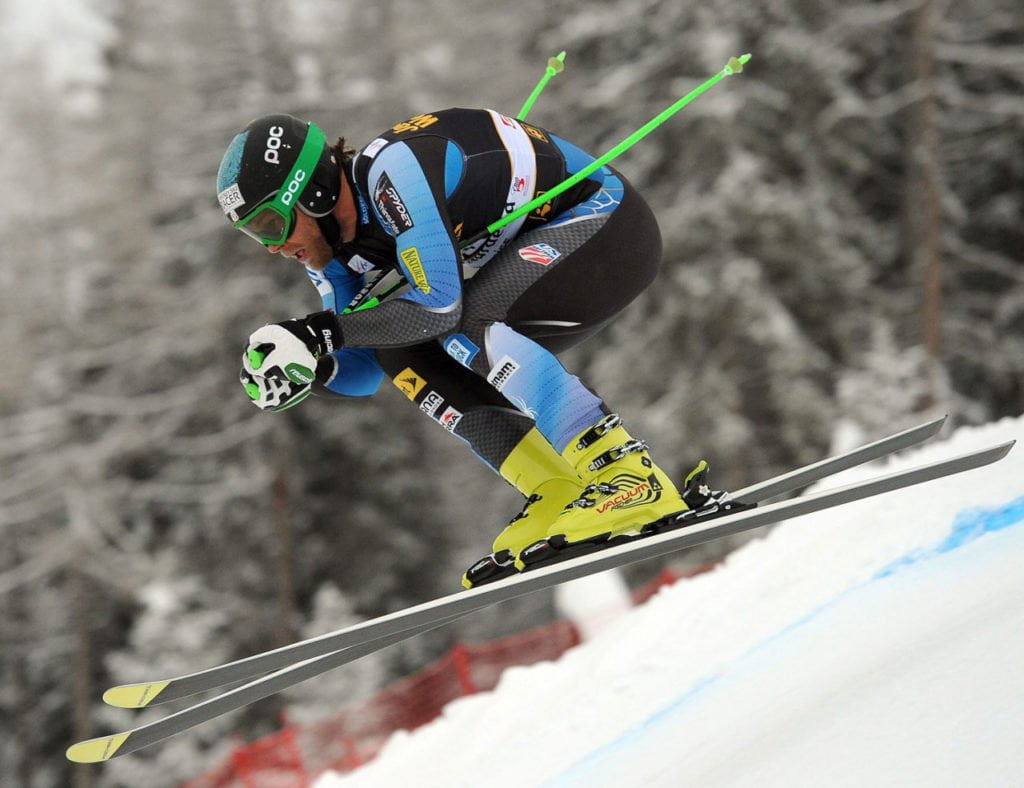
As FYFD wraps up coverage of #Sochi2014, let’s take a look at a winter sport not currently contested at the Olympics. This year’s Winter Games featured 12 new events. Speed skiing was not among them, though it was a demonstration sport in the 1992 Olympics. Like many of the sports in Sochi, speed skiing is gravity-driven, and friction and drag serve only to slow competitors. Speed skiing is about getting from the top of the course to the bottom, in a straight line, as fast as possible. Athletes reach velocities as high as 250 kph (155 mph), and aerodynamics are of the utmost concern. The skiers’ rubberized speed suits include airfoil-shaped fairings behind their calves that mold the airflow, and athletes wear giant aerodynamic helmets to smooth flow over their heads and shoulders. They spend their entire descent in an aerodynamic tuck, arms extended ahead of them like a cyclist in a time trial. It looks a pretty crazy ride. Would you like to see it added to the Olympics? (Video credit: R. Sill/University of Cambridge)
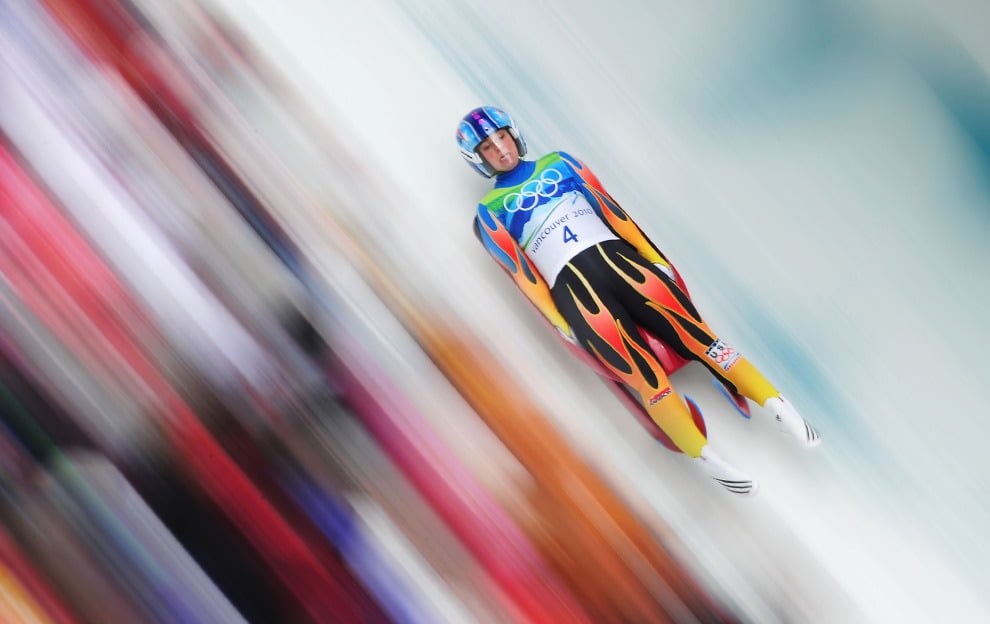
FYFD is celebrating #Sochi2014 with a look at fluid dynamics in winter sports. Check out the previous poss on why ice is slippery, the aerodynamics of speedskating, and how lugers slide fast.


