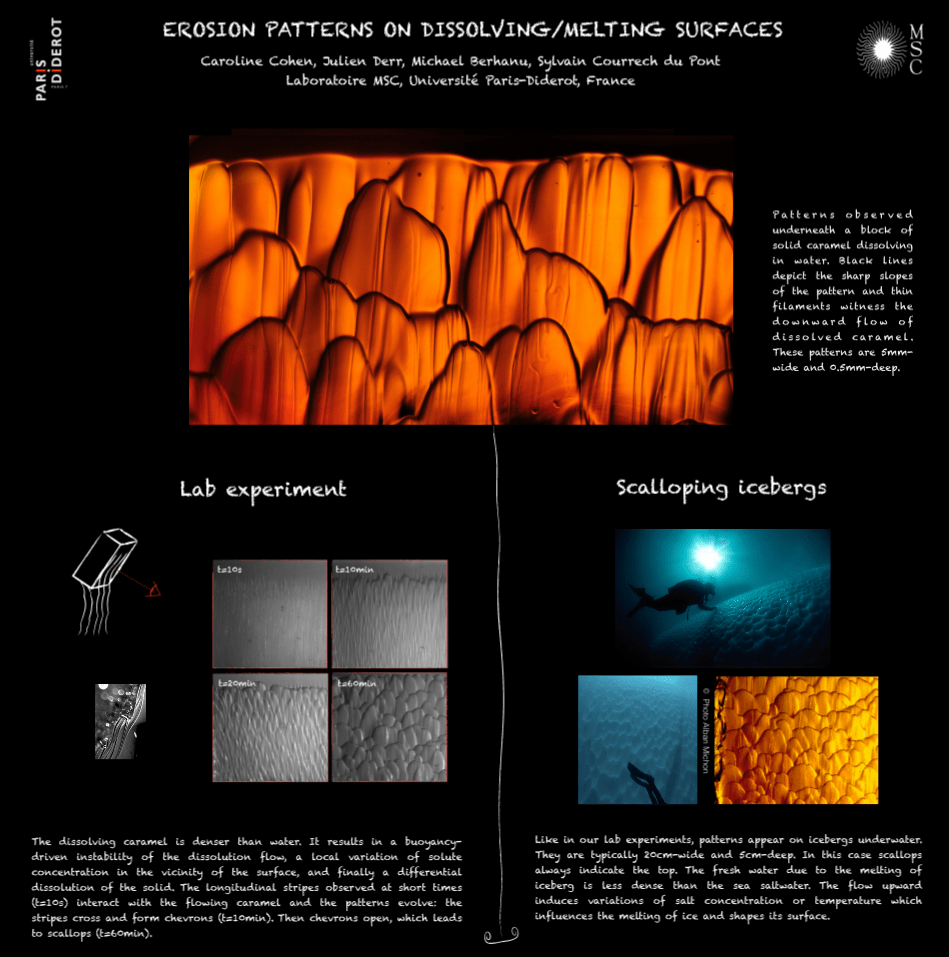
What do icebergs and caramel have in common? Both have similar scalloped erosion patterns as they dissolve. When caramel dissolves in water, the denser caramel sinks in the buoyant water. An initially smooth surface will first form lines, then the flowing caramel and the uneven surface interact, forming chevrons, followed by larger scallops. A similar process happens with melting icebergs. The meltwater from an iceberg is less dense than the surrounding seawater, so it will rise as it melts. This causes variations in the salt concentration and temperature near the iceberg, which cause it to melt differently in different spots, ultimately leading to the same scallop shapes observed in the caramel. Check out the full-size PDF of the poster here. (Image credit: C. Cohen et al.)
Category: Research

Drinking in Space
Earlier this year, the Capillary Beverage experiment launched to the International Space Station with new open-topped “Space Cups” for astronauts to test. Now those of us back on Earth are getting a glimpse of the cups in microgravity action. The geometry of the cups is wide on the back-end with a tightening v-shape near the mouth. This shape guides the liquid by using capillary action to wick it toward the spout.
One of the key goals of the experiment was to observe how the liquid drained–what shape it assumed in the cup and where and how much liquid was left behind. The researchers want to compare the real-life performance of the cups with their numerical models and simulations, which will help design future microgravity liquid transport systems for fuel, waste management, and other applications.
Although the experiments have a wider purpose, the space cups also do a great job allowing astronauts to drink from more than just pouches. Check out the gallery demo above to see how they hold up against astronaut silliness! (Video and image credits: NASA/IRPI LLC, GIF source)
The Fluidic Oscillator


A fluidic oscillator is a device with no moving parts that sprays a fluid from side to side. The animations above illustrate how they work. A nozzle funnels a fluid jet through a chamber with two feedback channels. When the jet sweeps close to one side of the chamber, part of the fluid is directed along the feedback channel and back toward the inlet. That flow feeds into a recirculating separation bubble in the middle of the chamber. As that bubble grows, it pushes the jet back toward the other feedback channel, continuing the cycle. Many automobiles use fluidic oscillators in their windshield washer sprays. Check out the award-winning full video from the Gallery of Fluid Motion. (Image credit: M. Sieber et al., source)
From Dripping to Beading
When water drips, it quickly breaks up into a string of smaller droplets due to a surface-tension-driven instability called the Plateau-Rayleigh instability. But adding just a tiny bit of polymer to the fluid changes the behavior entirely. Instead of breaking into droplets, a narrow filament dotted with tiny satellite droplets forms between the larger drops. This is known as the beads-on-a-string instability. The viscoelasticity the polymers add is one key to seeing this behavior. Polymers consist of large molecule chains that, when stretched, act a little like rubber bands–they pull back against the stretch, providing an elastic effect. Without this elasticity, the tiny filament connecting the drops would break up immediately. (Image credit: M. Berman, source; research credit: P. Bhat et al.)

Trampolining Droplet
Imagine a droplet sitting on a rigid surface spontaneously bouncing up and then continuing to bounce higher after each impact, as if it were on a trampoline. It sounds impossible, but it’s not. There are two key features to making such a trampolining droplet–one is a superhydrophobic surface covered in an array of tiny micropillars and the other is very low air pressure. The low-pressure, low-humidity air around the droplet causes it to vaporize. Inside the micropillar array, this vapor can get trapped by viscosity instead of draining away. The result is an overpressurization beneath the droplet that, if it overcomes the drop’s adhesion, will cause it to leap upward. For more, check out the original research paper or the coverage at Chemistry World. (Video credit and submission: T. Schutzius et al.)

Ignition
Shown here are the first instants after a bubble full of methane gas is ignited via laser. Using the schlieren optical method and a high-speed camera, scientists recorded the deflagration at 10,000 frames per second. Because schlieren imaging is very sensitive to small changes in density, we see not only the expanding flame front as the methane ignites but also the subtle waviness of the methane expanding into the surrounding air as the bubble bursts. (For comparison, check out what bursting a water balloon looks like at high-speed.) Be sure to head over to ScienceTake for the full schlieren video, and also check out this award-winning video of a match lighting made by the same researcher. (Image credit: V. Miller et. al.; full video: The New York Times; submitted by Rebecca M.)
ETA: An earlier version of this post mistakenly said the demo used a balloon full of methane rather than a bubble. Thanks to jump-first-think-later for the correction.
The Droplet Slide
One of the joys of science is the sense of discovery that can come even from looking at something seemingly simple. Take, for example, a water droplet sitting on a plate. If you slowly tilt the plate, the droplet’s shape will shift until a critical angle where it starts sliding down the plate. But what happens to two initially different droplets? As this video shows, tilting two droplets of initially different shapes and returning them to horizontal causes the droplets to assume the same shape. There’s a universal behavior at work here–like nature has a kind of reset button that makes gravity and surface tension work together such that a droplet will assume a preferred shape. For an experimentalist, it’s certainly a handy way to create repeatable experiments! (Video credit: M. Musterd et al.)
Deforming Soap Films
It’s the time of year when new Gallery of Fluid Motion videos start popping up online. We’ve already featured several and no doubt there will be more to come. Today’s post is a submission from Saad Bhamla, who gave this introduction to the work:
Soap bubbles occupy the rare position of delighting and fascinating both young children and scientific minds alike. Sir Isaac Newton, Joseph Plateau, Carlo Marangoni and Pierre-Gilles de Gennes, not to mention countless others, have discovered remarkable results in optics, molecular forces and fluid dynamics from investigating this seemingly simple system.
This video is a compilation of curiosity-driven experiments that systematically investigate the surface flows on a rising soap bubble. From childhood experience, we are familiar with the vibrant colors and mesmerizing display of chaotic flows on the surface of a soap bubble. These flows arise due to surface tension gradients, also known as Marangoni flows or instabilities. In this video, we show the surprising effect of layering multiple instabilities on top of each other, highlighting that unexpected new phenomena are still waiting to be discovered, even in the simple soap bubble.
As illustrated in the video, raising a bubble beneath the soap film moves surfactants in the film, which causes local differences in surface tension. Any time a difference in surface tension exists, fluid will flow from areas of low surface tension to ones with higher surface tension. This is called the Marangoni effect. On a soap bubble, this is visible in the chaotic swirling colors we see. In this system, Bhamla and his co-author found that by raising the bubble in steps, they could “freeze” the Marangoni-induced patterns created by the previous motion. (Video credit and submission: S. Bhamla et al.)
Visualizing Vortices
Flow visualization can be a valuable tool for understanding fluid dynamics. In this video, we see how it can help elucidate the mechanisms of flapping flight. By dyeing vortices from the leading edge in red rhodamine and vortices from the trailing edge in green fluorescein, it’s possible to distinguish their competing effects for wings of different size. The speed and efficiency of a flapping wing depends on the vortices it sheds–these provide its lift and thrust. On a short wing, the leading edge vortex is significant and spins in a counter-clockwise (positive) direction. When it reaches the trailing edge, it meets a vortex spinning clockwise (negative). The interference of the two vortices weakens the shed vortex, thereby slowing the wing. Lengthening the wing weakens the leading edge vortex, which reduces its interference at the trailing edge and makes the longer wings more efficient. (Video credit: T. Mitchel et al.; via @AlbanSauret)
Nectar-Eating Bats


Nectar-eating bats have evolved to use several methods to drink. Some bats, like the Pallas’ long-tongued bat (top), use a lapping method. Hair-like papillae on the bat’s tongue increase the contact area with the nectar, helping to draw the fluid up in viscous globs as the bat repeatedly dips its tongue into the nectar. The orange nectar bat (middle and bottom), in contrast, has a tongue with a long central groove. This bat’s tongue stays submerged as it drinks. Researchers hypothesize that muscle action along the tongue, combined with capillary action in the narrow groove, allow the bat to actively pump nectar up to its mouth. It’s worth noting that the edges of the bat’s tongue do not curl around to touch, so the bat is definitely not using suction as one would with a straw. (Image credit: M. Tschapka et al., source)


