
During explosions, solid particles and liquids packed around the explosive charges can form jets, making a blast wave appear more porcupine-like than spherical. The instability mechanisms that cause this behavior are not well-understood, but researchers suspect the jets are formed due to perturbations in the particle bed on the timescale of the initial shock propagation. The presence of these jets can affect the blast wave’s subsequent growth as well as the mixing in its wake. The number of jets produced depends on many factors, including particle type, the geometry of the charge, the ratio of explosive to particles, and even whether the particles are wet or dry. Note the very different natures of the explosions in the video when shown side by side. (Video credit: D. Frost et al)
Month: December 2011

Stick-Slip Bubbles
Varying the rate of injection of air into a wet granular mixture contained in a Hele Shaw cell results in very different flow patterns. At low injection rates, stick-slip bubbles form. As the injection rate increases, patterns are affected by “temporal intermittency” where continuous motion is occasionally interrupted by jamming. Increasing the injection rate still further results in Saffman-Taylor-like fingering. #

Structures in Turbulence
Despite its appearance, there is order in the chaos of turbulence. These snapshots from a turbulent channel flow simulation outline these coherent structures in black. The top photo shows a top view looking down on the channel and the bottom image shows a side view of the channel. It is thought that studying these coherent structures may help shed light on turbulence and its formation, which remains one of the great open questions of classical physics. (Photo credit: M. Green)

Splash Sheets


When a falling liquid jet hits a horizontal impacter, it is deflected into a sheet. The shape of the sheet is dependent upon the velocity of the jet and the viscosity of the fluid. At sufficiently high speeds the sheet will be circular; at lower speeds it may sag into a bell-shape. The circular sheets can also develop an instability that causes them to become polygonal, as shown in the photos above. The fluid then flows out along the sheet, into and along the rim, and then spouts outward in jets at the polygon’s corners. For some conditions, the jets at the corners even form a sort of fluid chain (top photo). (Photo credit: R. Buckingham and J. W. M. Bush; via 14-billion-years-later)
Viscoelastic Fluids in Space
In honor of astronaut Don Pettit’s launch to the International Space Station (and in the hope that he’ll do more neat microgravity fluids demonstrations while in space!), here’s a look a the behavior of viscoelastic fluids in microgravity. The elasticity of these fluids means that, when strained, the fluid deforms instantaneously and then returns to its initial shape when the strain is removed. Pettit demonstrates both Plateau-Rayleigh instability behavior, where a column of fluid breaks apart due to surface tension variations, and die swell, where a fluid jet expands beyond the diameter of nozzle from which it was extruded. Such swelling is commonly caused by the stretching and relaxation of polymers in the fluid as they react to forces caused by the nozzle opening.
Sound Sculptures
This is another fun and artistic use of non-Newtonian fluids (paint) vibrating on a speaker cone for advertising purposes. The shear-thinning viscous properties of the paint vie with surface tension to create lovely instantaneous sculptures of color. Check out Canon’s Pixma ads for similar artwork.
Particle Image Velocimetry
One common experimental technique for measuring velocity in a flow is particle image velocimetry (PIV), shown above. Special particles are introduced–seeded–into the flow. Typically, these particles are small, neutrally buoyant, and have a refractive index significantly different from the background flow. One or more lasers are used to illuminate a section of the flow–a plane for 2D measurements or a cube for 3D. Rather than operating continuously, the laser is pulsed, producing very short exposure times of the order of hundreds of nanoseconds. A camera (or more than one camera for 3D measurements) captures a pair of images separated by this short exposure. The time between frames is so small that the particles will not have moved much between frames. Researchers can then correlate the two frames and derive velocity data from the motion of the particles.

Wave Clouds Over Alabama
Last week, Birmingham, Alabama got treated to a special cloudy day, thanks to some Kelvin-Helmholtz waves, shown above. When a layer of faster moving fluid shears a slower moving fluid, this instability can form and cause some spectacular mixing. In this case, the lower, slower fluid was cool and moist enough to contain clouds, enabling us to see the effect with the naked eye. The same mechanism is responsible for the shape of breaking ocean waves and can even be seen in the atmospheres of gas giants like Saturn and Jupiter. (submitted by David B)
Leaping Shampoo
The Kaye effect is a neat phenomenon associated with falling shear-thinning non-Newtonian fluids like shampoo or hand soap. As the falling liquid piles up after hitting a solid surface, it ejects streams of fluid upwards. The effect usually only lasts for a few hundred milliseconds, but it is possible to see it at home without a high-speed camera if you pay close attention. More detailed physics of the effect are discussed in this previously featured video.

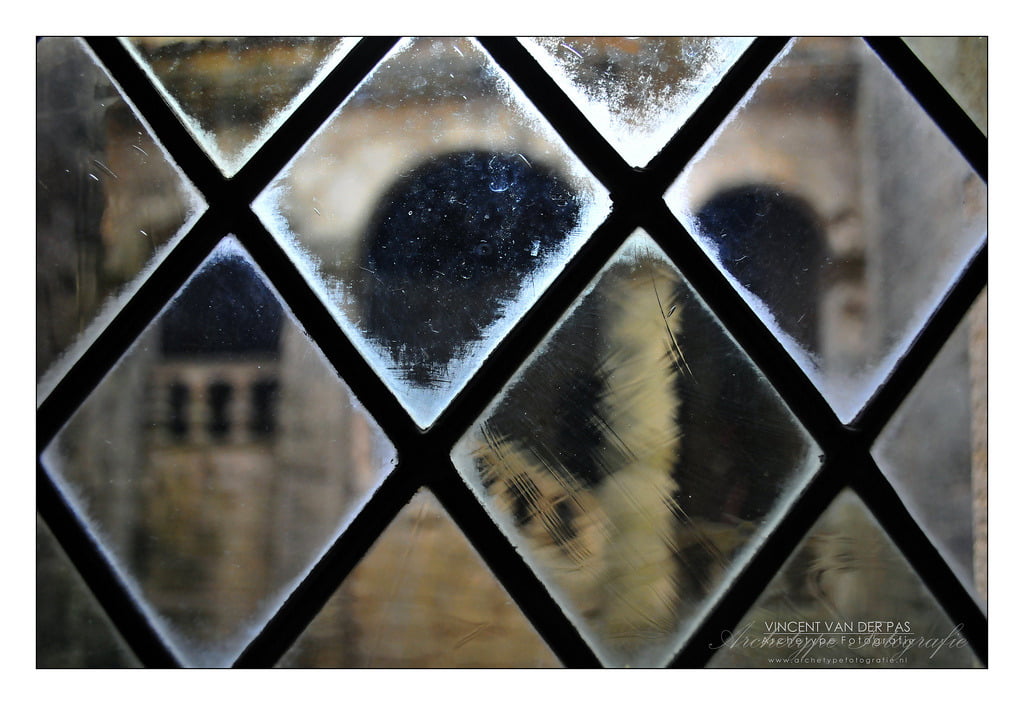
Glass Isn’t a Fluid
Mark R writes:
Glass is a Fluid, Too
Post complex equations regarding how long it would take a certain window to flow, and post pictures of sunken glass. This would be educational.This is a pretty widespread myth. Actually, glass is not a fluid and does not behave like one as long as it is below the glass transition temperature. It’s a bit difficult to classify glass under the traditional categories for a solid due to its phase transition behavior and its lack of crystallization, but it is usually classed as an amorphous solid.
The observation that old panes of glass tend to be thicker at the bottom is usually used as evidence that glass flows over the centuries, but this assumes that the glass was flat to begin with. However, glassblowers at the time usually made panes by spinning molten glass to create a round, mostly even flat, which was then cut to fit. Although spinning made the glass mostly flat, the edges of the disc tended to be thinner. When installed, the glass was typically placed thicker side down for stability purposes. One researcher even calculated the time period necessary for glass to flow and deform at ordinary temperatures as 10^32 years–longer than the age of the universe.
If that is not convincing, consider this: if glass flows at a rate that’s discernible to the naked eye after a couple of centuries, then the effect of this deformation should be extremely noticeable in antique telescopes since a slight change in the lens’ optical properties should dramatically affect performance. But no such degradation occurs. (Photo credit: Vincent van der Pas)

