
Lake Erie, the shallowest of the Great Lakes, sees large swings in ice cover over the winter. In late January 2022, the lake was nearly completely frozen over, with 94 percent of its area covered in ice. By February 3rd, ice cover had dropped to 62 percent before rising again to 90 percent by the 5th. Air temperature and wind are the primary drivers of Erie’s fast ice growth and decay. As storms roll through, the ice can spread rapidly, but once temperatures rise, it takes very little forcing from the wind for the ice to begin breaking up. (Image credit: J. Stevens/USGS; via NASA Earth Observatory)
Tag: wind

December’s Derecho
I confess I’d never heard the term derecho before moving to Colorado, but I’ve experienced a few of these wind storms now. They’re intense! Last December’s derecho formed when a high-pressure system in the western United States met a strong low-pressure system over the northern plains. In fluids, flow moves preferentially from areas of high pressure to those with low pressure, and that’s no different when it comes to weather. The strong pressure gradient drove high winds from the Rocky Mountains to Minnesota. The animation above shows the strongest winds in in yellow-white but even the “weaker” pink areas saw winds comparable to a fast-moving car in speed. The visualization is constructed from data reported by ships, buoys, aircraft, satellites, and other sources, all processed through a NASA weather algorithm. (Image credit: J. Stevens/NASA; via NASA Earth Observatory)

Where Wind Meets Water
That the wind causes ocean waves is obvious to anyone who has spent time near the water, but the details of that process remain fuzzy. Many of the explanations — like the Kelvin-Helmholtz instability — only explain part of the process, usually the beginning when the waves are very small. As the waves get larger, they affect the wind in turn, complicating matters.
As messy as the theory gets, our ability to measure the wind and water in situ is limited, too. Just look at this wild research platform oceanographers designed to study wind and waves. It’s part of a 355-ft vessel that’s towed out to sea horizontally and then flipped so that 300 feet of it remain underwater to stabilize the remainder for measurements. Even with equipment like this, measuring the turbulent air and water near the ocean-sky interface is incredibly difficult.
This review article gives a nice overview of different historical efforts to explain how wind makes waves and provides a snapshot of the latest research in the area. (Image credit: R. Bilcliff; see also N. Pizzo et al.)

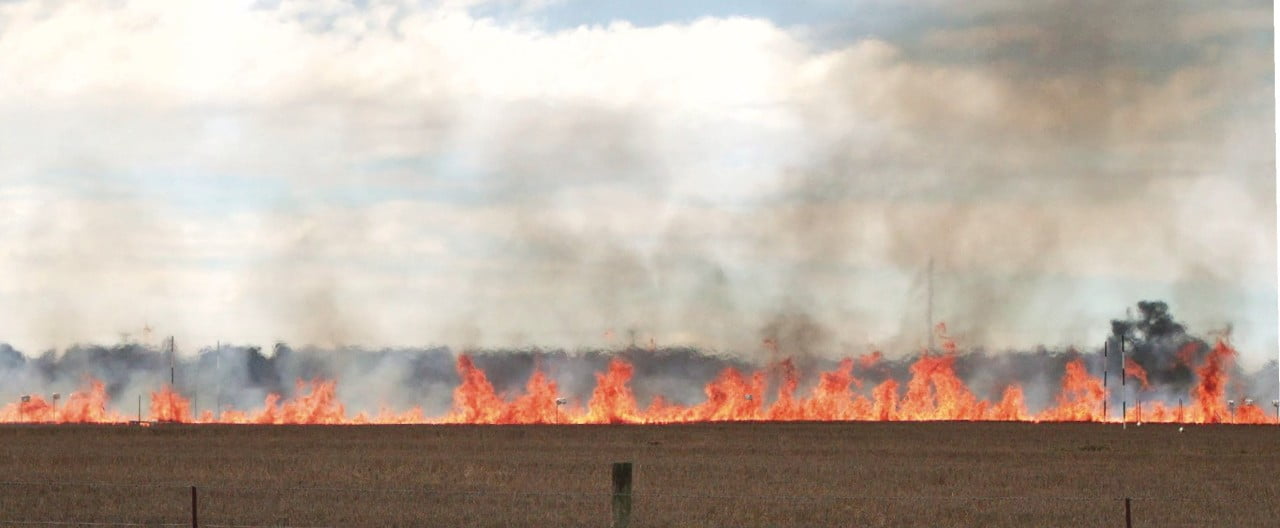
Understanding Wildfire


Wildfires are an ongoing challenge in the western United States, where droughts and warmer conditions have combined with a century of fire suppression to form perfect conditions for monstrous fires. It’s long been understood that ambient winds can drive spreading fire, but the connection between wildfire and wind is more complicated than this.
The heat of a fire drives buoyant air to rise, creating tower-like updrafts in a flame front. We see this both in the shape of the grass fire above, and in the wind vectors of a simulated grass fire in the lower image. Between those towers are troughs where cooler ambient wind is drawn in to replace the rising air. How a fire spreads will depend on the speed, direction, and temperature of these winds. A hot wind fed by the fire’s heat will raise the temperature of fuel in unburned areas, bringing it closer to ignition. In contrast, cooler ambient winds can hinder a fire by keeping nearby grass and twigs too cool to ignite. (Image credit: fire – M. Finney/US Forest Service; simulation – R. Linn; research credit: R. Linn et al.; for more, see Physics Today)

Reader Question: White Caps
Reader eclecticca asks:
I really like the last two posts about waves, and they left me with another question… My dad had a little boat he used to take us ocean fishing on quite a bit. I always noticed that some days we just had big waves (swells) when out from the coastline and in fairly deep water (a hundred feet to hundreds of feet according to the depth sounder) and other days those swells would “break” and curl and foam and crash in on themselves, being what we called “breakers” or “white caps”. There is no shore to create the breakers in this case, so what is happening? Is it due to wind? current a combination of factors? Always been kind of curious about this really…
You’re exactly right: those open ocean white caps are due to wind. Strictly speaking, the wind is what’s causing all* of the waves out in open, deep waters. But once the wind is strong enough, it starts breaking up the crests of waves, creating those foamy white tops.
According to one study, the break-up happens when the wind transfers more energy to the wave than surface tension can withstand. When the wave crest breaks up into a mixture of air, spray, and foam, it effectively gives the wind more surface area to push against and continue transferring energy. (Image credit: M. Moers)
* With a few notable exceptions, like in the case of a tsunami.

Plant Week: Bunchberry Dogwood
The bunchberry dogwood, unlike its taller relatives, is a low-lying subshrub that spreads along the ground. But it sports some of the fastest action of any plant, requiring 10,000 frames per second to capture! When young buds form in the bunchberry flower, their four petals are fused, completely hiding the stamens. As the plant matures, the pollen-carrying stamens grow faster than the petals, causing them to peek out the sides of the bud. But the petals stay attached at the tip, holding the stamens in while pressure inside the stamens creates a store of elastic energy.
When disturbed, the petals break loose and the stamens spring up and out. The anthers at their tips hold the pollen in place until the stamen reaches its maximum vertical velocity, at which point the anthers swing out to release the pollen upward. In essence, the flower works in the same manner as a trebuchet, flinging pollen with an acceleration 2,400 times greater than gravity. That’s enough to coat pollen onto nearby insects and to launch the remainder high enough for the wind to catch it. (Image and research credit: D. Whitaker et al., source; via Science News; submitted by Kam-Yung Soh)
And with that, FYFD’s Plant Week is a wrap! Missed one of the previous posts? You can catch up with them here.
Amber Waves
When I was a teenager, I liked riding my bike along the river boardwalk near my house. There were fields there, like those in the image above and video below, with tall grass that would bend and sway in the wind. The long stalks undulated almost like a fluid, and they were mesmerizing. This video gives you a higher vantage point, where you can see the larger patterns of motion. What you’re seeing, I think, are some of the large-scale turbulent variations in the wind. Rather than being uniform and laminar, the wind contains pockets of turbulent gusts, which the sway of the long grass reveals to the naked eye. In terms of physical mechanism, I suspect it’s similar to how wind imprints its patterns on water. (Video and image credit: N. Moore)

Dune Networks
In sandy deserts, winds can build a vast network of dunes whose shapes depend on the winds that built them. This photograph, taken by an astronaut aboard the International Space Station, shows part of a Saharan dune field known as the Grand Erg Oriental. Of the five basic types of sand dunes, this field features all but one. The predominant winds of the region build most of the dunes into long, straight chains separated by interdune flats some 150 meters lower in elevation. Within the chains, there are linear dunes, created by winds blowing nearly parallel to the dune’s long axis. In places where winds tend to change directions, several linear dunes may merge to form star dunes, like the one just below and right of center in the image. Transverse dunes form perpendicular to the predominant wind direction. The one shown in the upper left of this image may have formed when multiple crescant-shaped barchan dunes merged. (Image credit: NASA, via NASA Earth Observatory)
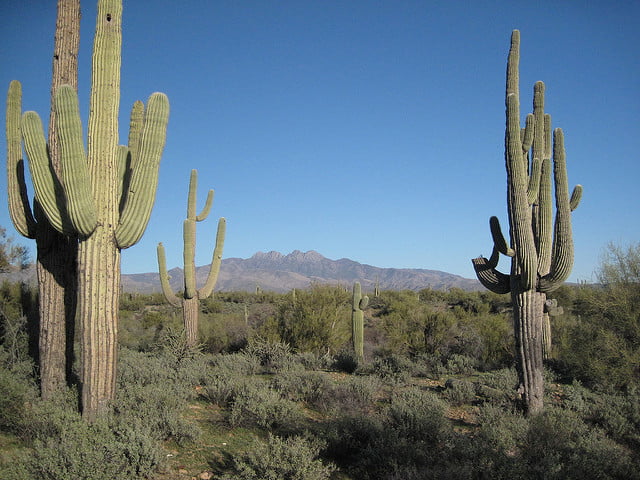
Withstanding Windstorms
Saguaro cacti can grow 15 meters tall, and despite their shallow root systems can withstand storm winds up to 38 meters per second without being blown over. Grooves in the cacti’s surface may contribute to its resilience, by adding structural support and/or through reducing aerodynamic loads. The latter theory mirrors the concept of dimples on a golf ball; namely, grooves create turbulence in the flow near the cactus, which allows air flow to track further around the cactus before separating. The result is less drag for a given wind speed than a smooth cactus would experience.
Indeed, recent experiments on a grooved cylinder with a pneumatically-controlled shape showed exactly that; the morphable cylinder’s drag was consistently significantly lower than fixed samples. Cacti do change their shapes somewhat as their water content changes, but they don’t have the ability for up-to-the-minute alterations. Nevertheless, their adaptations can inspire engineered creations that morph to reduce wind impact. (Image credit: A. Levine; research credit: M. Guttag and P. Reis)
Windy Urban Corridors (*)


For pedestrians, windy conditions can be uncomfortable or even downright dangerous. And while you might expect the buildings of an urban environment to protect people from the wind, that’s not always the case. The image above shows a simulation of ground-level wind conditions in Venice on a breezy day. While many areas, shown in blue and green, have lower wind speeds, there are a few areas, shown in red, where wind speeds are well above the day’s average. This enhancement often occurs in areas where buildings constrict airflow and funnel it together. The buildings create a form of the Venturi effect, where narrowing passages cause local pressure to drop, driving an increase in wind speed. Architects and urban designers are increasingly turning to numerical simulations and CFD to study these effects in urban environments and to search for ways to mitigate problems and keep pedestrians safe. (Image credits: CFD analysis – SimScale; pedestrians – Saltysalt, skolnv)
(*) This post was sponsored by SimScale, the cloud-based simulation platform. SimScale offers a free Community plan for anyone interested in trying CFD, FEA and thermal simulations in their browser. Sign up for a free account here.
For information on FYFD’s sponsored post policy, click here.


