NASA’s recent full-scale ground test of their Space Launch System (SLS) rocket was notable for more than just the engine. It was an opportunity to use a new high dynamic range, high speed camera prototype,
HiDyRS-X, to capture the rocket’s exhaust in detail never seen before. Usually the extreme brightness of the rocket exhaust makes it impossible to see any structure in the flow without completely obscuring the ground equipment. With this camera, however, engineers can see how the engine, exhaust, and surroundings all interact. Be sure to check out the full video. I particularly like watching how the rocket’s exhaust entrains dust and sand from the ground nearby. (Image credit: NASA, source; submitted by Chris P. and Matt S.)
This spectacular Hubble image shows the Bubble Nebula. The source of this nebula is the star seen toward the upper left side of the bubble. This massive, super-hot star has ceased to fuse hydrogen and is now fusing helium, powering its way to a likely end as a supernova. As it burns, the star emits a stellar wind of gas moving at over 6.4 million kilometers an hour. As the flow moves outward, it encounters colder dense gases that it pushes along as it expands; this is the blue bubble surface that we see. The asymmetry of the bubble with respect to its source star is caused by the variation in the surrounding gas’s density. The bubble’s front moves more slowly in areas with more gas, thus making the bubble appear lop-sided. (Image credit: NASA; via Gizmodo)
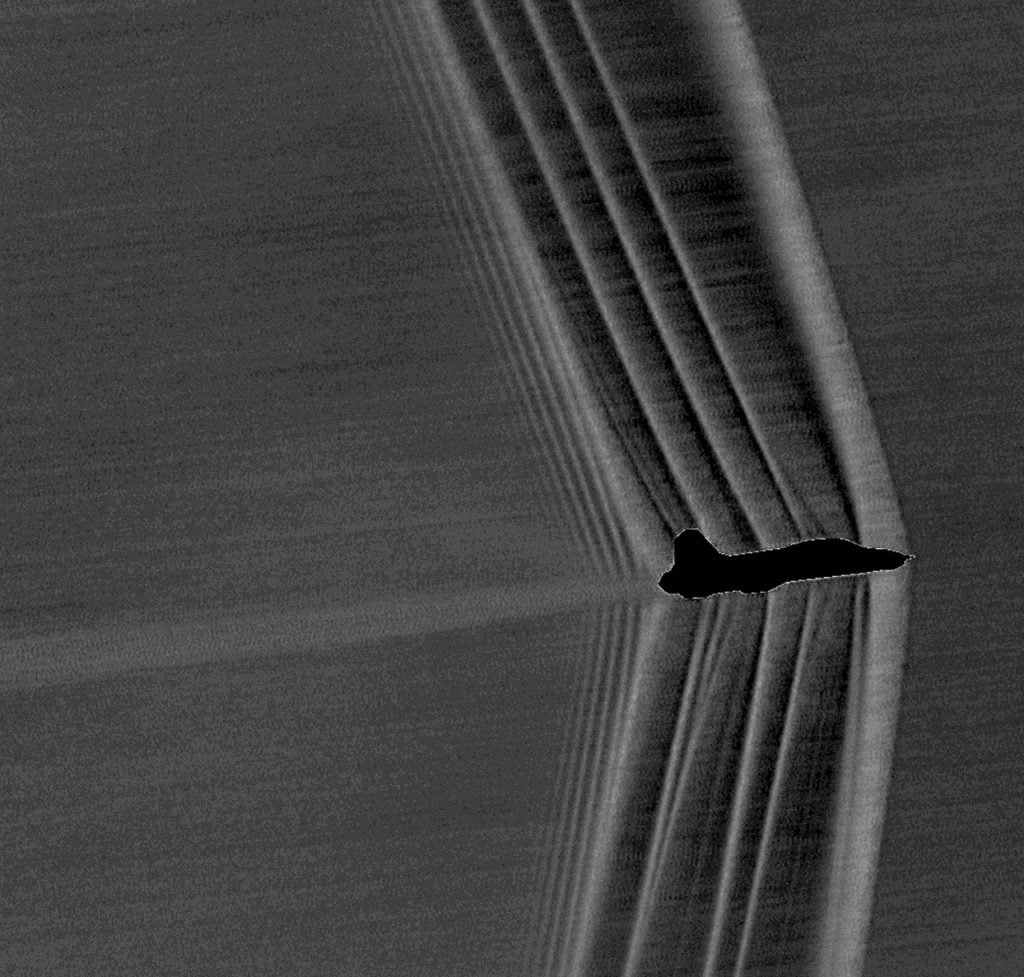
This week NASA released two new images of the shock waves surrounding T-38C jets in free flight. They’re the result of NASA’s new adaptations of the schlieren photography technique, which has let scientists visualize shock waves (in the lab, at least) for more than a century. To celebrate, I thought it would be fun to demonstrate some of the data engineers can extract from images like the one above. So I’m going to show you how to calculate how fast this plane was flying!
Shock waves depend a lot on geometry. This is not too surprising, really, since shock waves are nature’s way of quickly turning the air because there’s an object in the way. This leads to a very powerful observation, though: the angle of a shock wave depends on the geometry of the object and the Mach number of the flow. (The Mach number is the ratio of an object’s speed to the local speed of sound, so an object moving at Mach 1 is moving at the speed of sound.)
The reverse observation is also true: if we can measure the angle of a shock wave from a known geometry, then we can calculate the Mach number. Now, I don’t have any special information about the geometry of a T-38, so most of the shock waves in this picture can’t tell me much quantitatively.
But, it turns out, I don’t need to know anything about the geometry of the plane to figure out its Mach number. That’s because that very first shock wave over on the right is coming off a sharp probe mounted over the airplane’s nose. The probe is sharp enough, in fact, that I can treat it as though it’s a tiny point disturbance. That means that rightmost shock wave is a special kind of shock known as a Mach wave, and its geometry depends solelyon the Mach number. It’s a pretty simple equation, too:
So, all I have to do is fire up some software like GIMP or ImageJ and estimate the angle of that first shock wave.
I came up with an estimate of about 77 degrees for the shock wave angle, which gives Mach 1.026 for the plane’s speed. Keep in mind that a) I’m using a grainy photo; and b) I have no information about the plane’s orientation relative to the camera. Nevertheless, NASA’s caption reports that this plane was moving at Mach 1.05 in the picture. My quick and dirty estimate is only off by 2%!
Of course, engineers are interested in a lot more than estimating an aircraft’s speed from these photos. With a little more geometry information, they can gather a lot of useful data from these images. One of the goals for the new photography technique is to help study new aircraft designs that generate weaker shock waves and quieter sonic booms. (Original images: NASA)
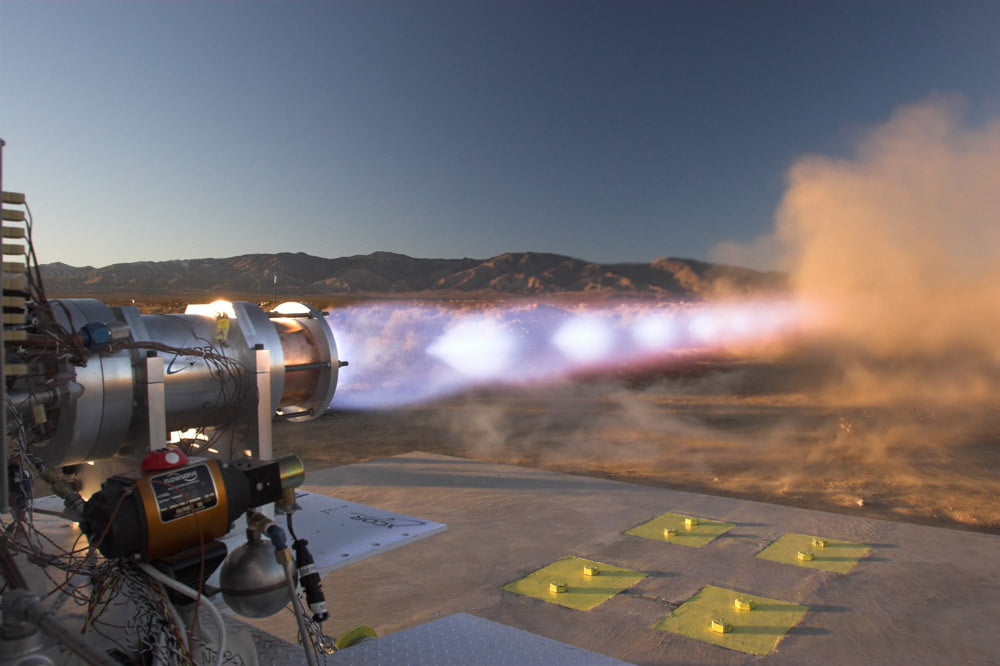
Rocket engine exhaust often contains a distinctive pattern known as shock diamonds or Mach diamonds. These are a series of shock waves and expansion fans that increase and decrease, respectively, the supersonic exhaust gases’ pressure until it equalizes with atmospheric pressure. The bright glowing spots visible to the naked eye are caused by excess fuel in the exhaust igniting. As awesome as shock diamonds look, they’re actually an indication of inefficiencies in the rocket: first, because the exhaust is over- or underexpanded, and second, because combustion inside the engine is incomplete. Both factors reduce a rocket engine’s efficiency (and both are, to some extent, inescapable). (Photo credit: XCOR)
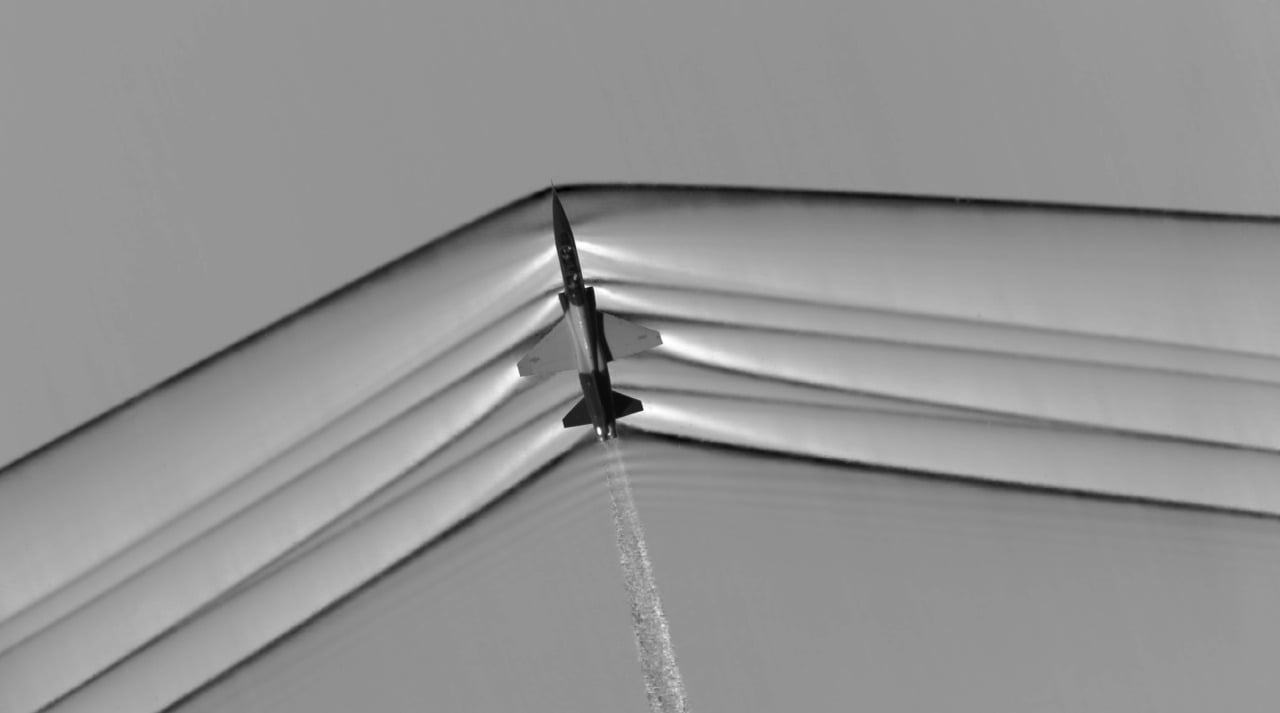
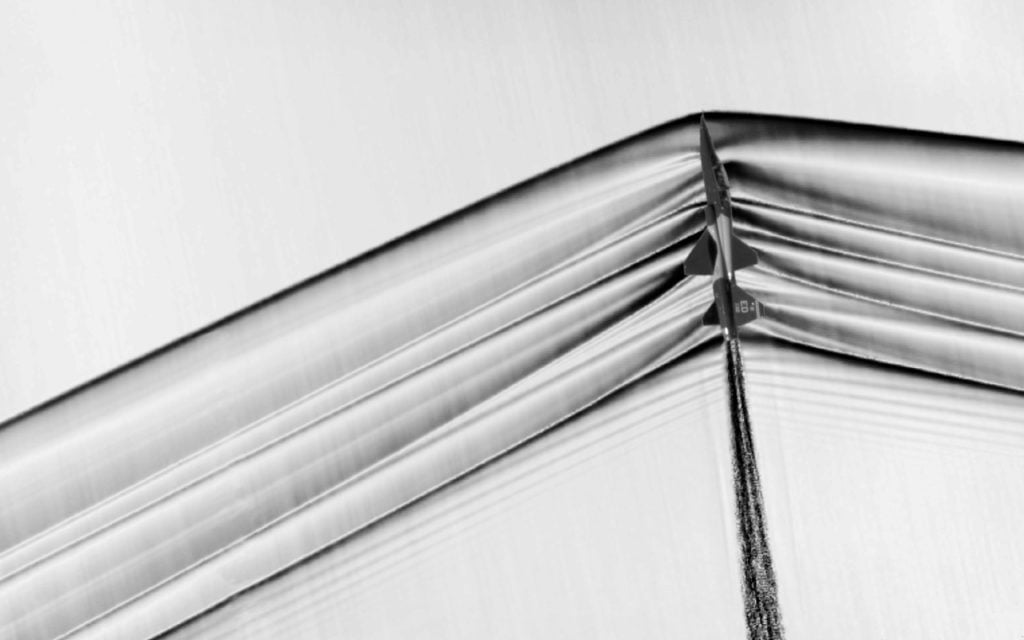
Schlieren optical systems have been used to visualize shock waves in labs for more than a century, but the technique did not translate well to photographing shock structures outside the lab. But now NASA’s Armstrong Research Center and Ames Research Center have developed a method that allows them to capture highly-detailed images of the shock waves around airplanes while they are flying. This is incredible stuff. Be sure to check out the high-resolution versions on this page, along with more description of the coordination necessary to pull off the photos.
The light and dark lines you see emanating from the airplane are places with strong density gradients. The dark lines are mostly shock waves, with the strongest shock waves appearing black due to the large change in air density. Many of the light streaks are expansion fans, areas where the density and pressure drop as air speeds up.
The goal of this research is to better understand shock wave structures around supersonic planes in order to reduce the noise supersonic aircraft cause when flying overhead. As you can see in the photos, the shock waves at the nose and tail of the aircraft persist far away from the aircraft; these are what cause the twin sonic boom heard when the plane flies by. (Photo credit: NASA; via J. Hertzberg)
How do you test a supersonic car like the Bloodhound SSC in a wind tunnel? With free-flying objects like airplanes, wind tunnel testing is relatively straightforward. Mounting a stationary model in a supersonic flow gives an equivalent flow-field to that object flying through still air at supersonic speeds. The same does not hold true for the supersonic car, though, because you need to account for the effect of the ground on airflow. One option is to build a moving wall in the wind tunnel. For low-speed applications, this is feasible but incredibly complicated and very expensive. For supersonic speeds, it’s impossible. You could achieve the same moving-wall effect at supersonic speeds with a rocket sled, but that is also expensive and difficult to fit in most experimental facilities. The simplest solution is the one you see above – build two models and mount them belly-to-belly. Reflecting the models makes the plane of symmetry a stagnation plane, which, fluid dynamically speaking, acts like an imaginary ground plane relative to the model. For more on the project and the technique, check out this article. (Photo credit: B. Evans; via ThinkFLIP; submitted by G. Doig)
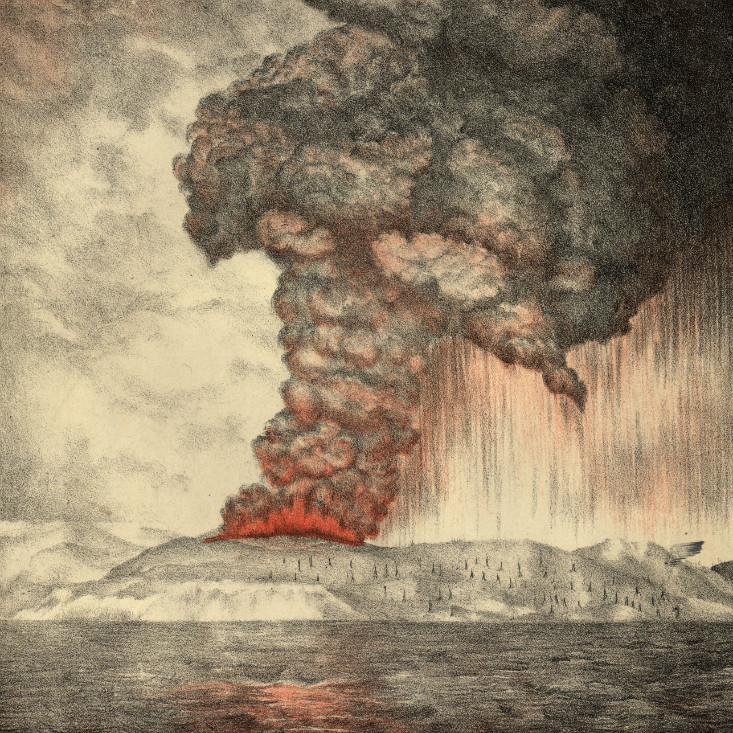
Volcanoes seem to be a common topic these days. Yesterday Nautilus published a great piece by Aatish Bhatia on the 1883 eruption of Krakatoa, which tore the island apart and unleashed a sound so loud it was heard more than 4800 km away:
The British ship Norham Castle was 40 miles from Krakatoa at the time of the explosion. The ship’s captain wrote in his log, “So violent are the explosions that the ear-drums of over half my crew have been shattered. My last thoughts are with my dear wife. I am convinced that the Day of Judgement has come.“
In general, sounds are caused not by the end of the world but by fluctuations in air pressure. A barometer at the Batavia gasworks (100 miles away from Krakatoa) registered the ensuing spike in pressure at over 2.5 inches of mercury. That converts to over 172 decibels of sound pressure, an unimaginably loud noise. To put that in context, if you were operating a jackhammer you’d be subject to about 100 decibels. The human threshold for pain is near 130 decibels, and if you had the misfortune of standing next to a jet engine, you’d experience a 150 decibel sound. (A 10 decibel increase is perceived by people as sounding roughly twice as loud.) The Krakatoa explosion registered 172 decibels at 100 miles from the source. This is so astonishingly loud, that it’s inching up against the limits of what we mean by “sound.” #
Those are some mindbogglingly enormous numbers. Aatish does a wonderful job of explaining the science behind an explosion whose effects ricocheted through the atmosphere for days afterward. Check out the full article over at Nautilus. (Image credit: Parker & Coward, via Wikipedia)
In February 2013 a meteor streaked across the Russian sky and burst in midair near Chelyabinsk. A recent Physics Today article summarizes what scientists have pieced together about the meteor, from its origins to its demise. The whole article is well worth reading. Here’s a peek:
The Chelyabinsk asteroid first felt the presence of Earth’s atmosphere when it was thousands of kilometers above the Pacific Ocean. For the next dozen minutes, the 10 000-ton rock fell swiftly, silently, and unseen, passing at a shallow angle through the rarefied exosphere where the molecular mean free path is much greater than the 20-m diameter of the rock. Collisions with molecules did nothing to slow the gravitational acceleration as it descended over China and Kazakhstan. When it crossed over the border into Russia at 3:20:20 UT and was 100 km above the ground, 99.99997% of the atmosphere was still beneath it.
Because the asteroid was moving much faster than air molecules could get out of its way, the molecules began to pile up into a compressed layer of high-temperature plasma pushing a shock wave forward. Atmospheric density increases exponentially with depth, so as the asteroid plunged, the plasma layer thickened and its optical opacity rapidly increased. About one second later, at 95 km above the surface, it became bright enough to be seen from the ground. That was the first warning that something big was about to happen. #
How often are scientific articles that gripping?! Kring and Boslough provide some excellent descriptions of the aerodynamics of the meteor and its airburst. Be sure to check it out. (Photo credit: M. Ahmetvaleev; paper credit: D. Kring and M. Boslough; via io9)
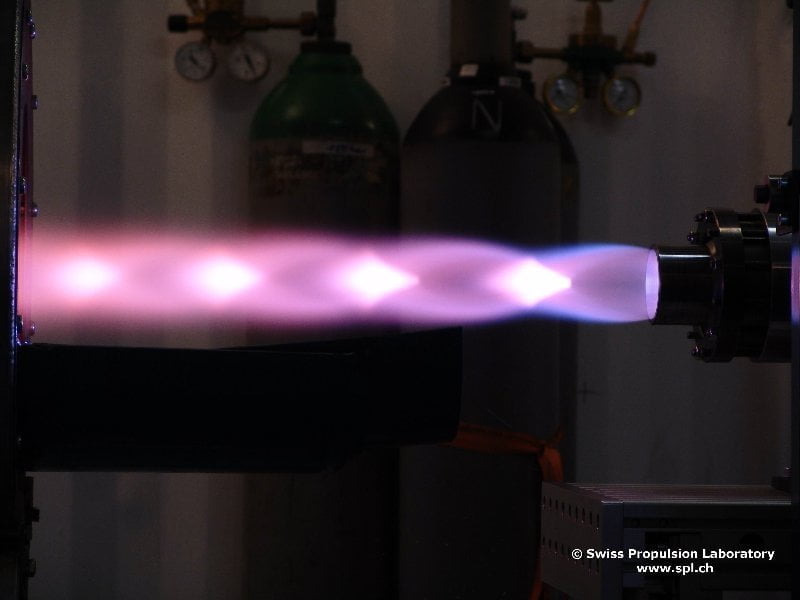
Rocket engines often feature a distinctive pattern of diamonds in their exhaust. These shock diamonds, also known as Mach diamonds, are formed as result of a pressure imbalance between the exhaust and the surrounding air. Because the exhaust gases are moving at supersonic speeds, changing their pressure requires a shock wave (to increase pressure) or an expansion fan (to decrease the pressure). The diamonds are a series of both shock waves and expansion fans that gradually change the exhaust’s pressure until it matches that of the surrounding air. This effect is not always visible to the naked eye, though. We see the glowing diamonds as a result of ignition of excess fuel in the exhaust. As neat as they are to see, visible shock diamonds are actually an indication of inefficiencies in the rocket: first because the exhaust is over- or under-pressurized, and, second, because combustion inside the engine is incomplete. (Photo credit: Swiss Propulsion Laboratory)
Many situations can generate high-speed liquid jets, including droplet impacts, vibrated fluids, and surface charges. In each of these cases, a concave liquid surface is impulsively accelerated, which causes the flow to focus into a jet. The image above shows snapshots of a microjet generated from a 50 micron capillary tube visible at the right. This jet formed when the meniscus inside the capillary tube was disturbed by a laser pulse that vaporized fluid behind the interface. Incredibly, the microjets generated with this method can reach speeds of 850 m/s, nearly 3 times the speed of sound in air. Researchers have found the method produces consistent results and suggest that it could one day form the basis for needle-free drug injection. You can read more in their freely available paper. (Photo credit: K. Tagawa et al.)


