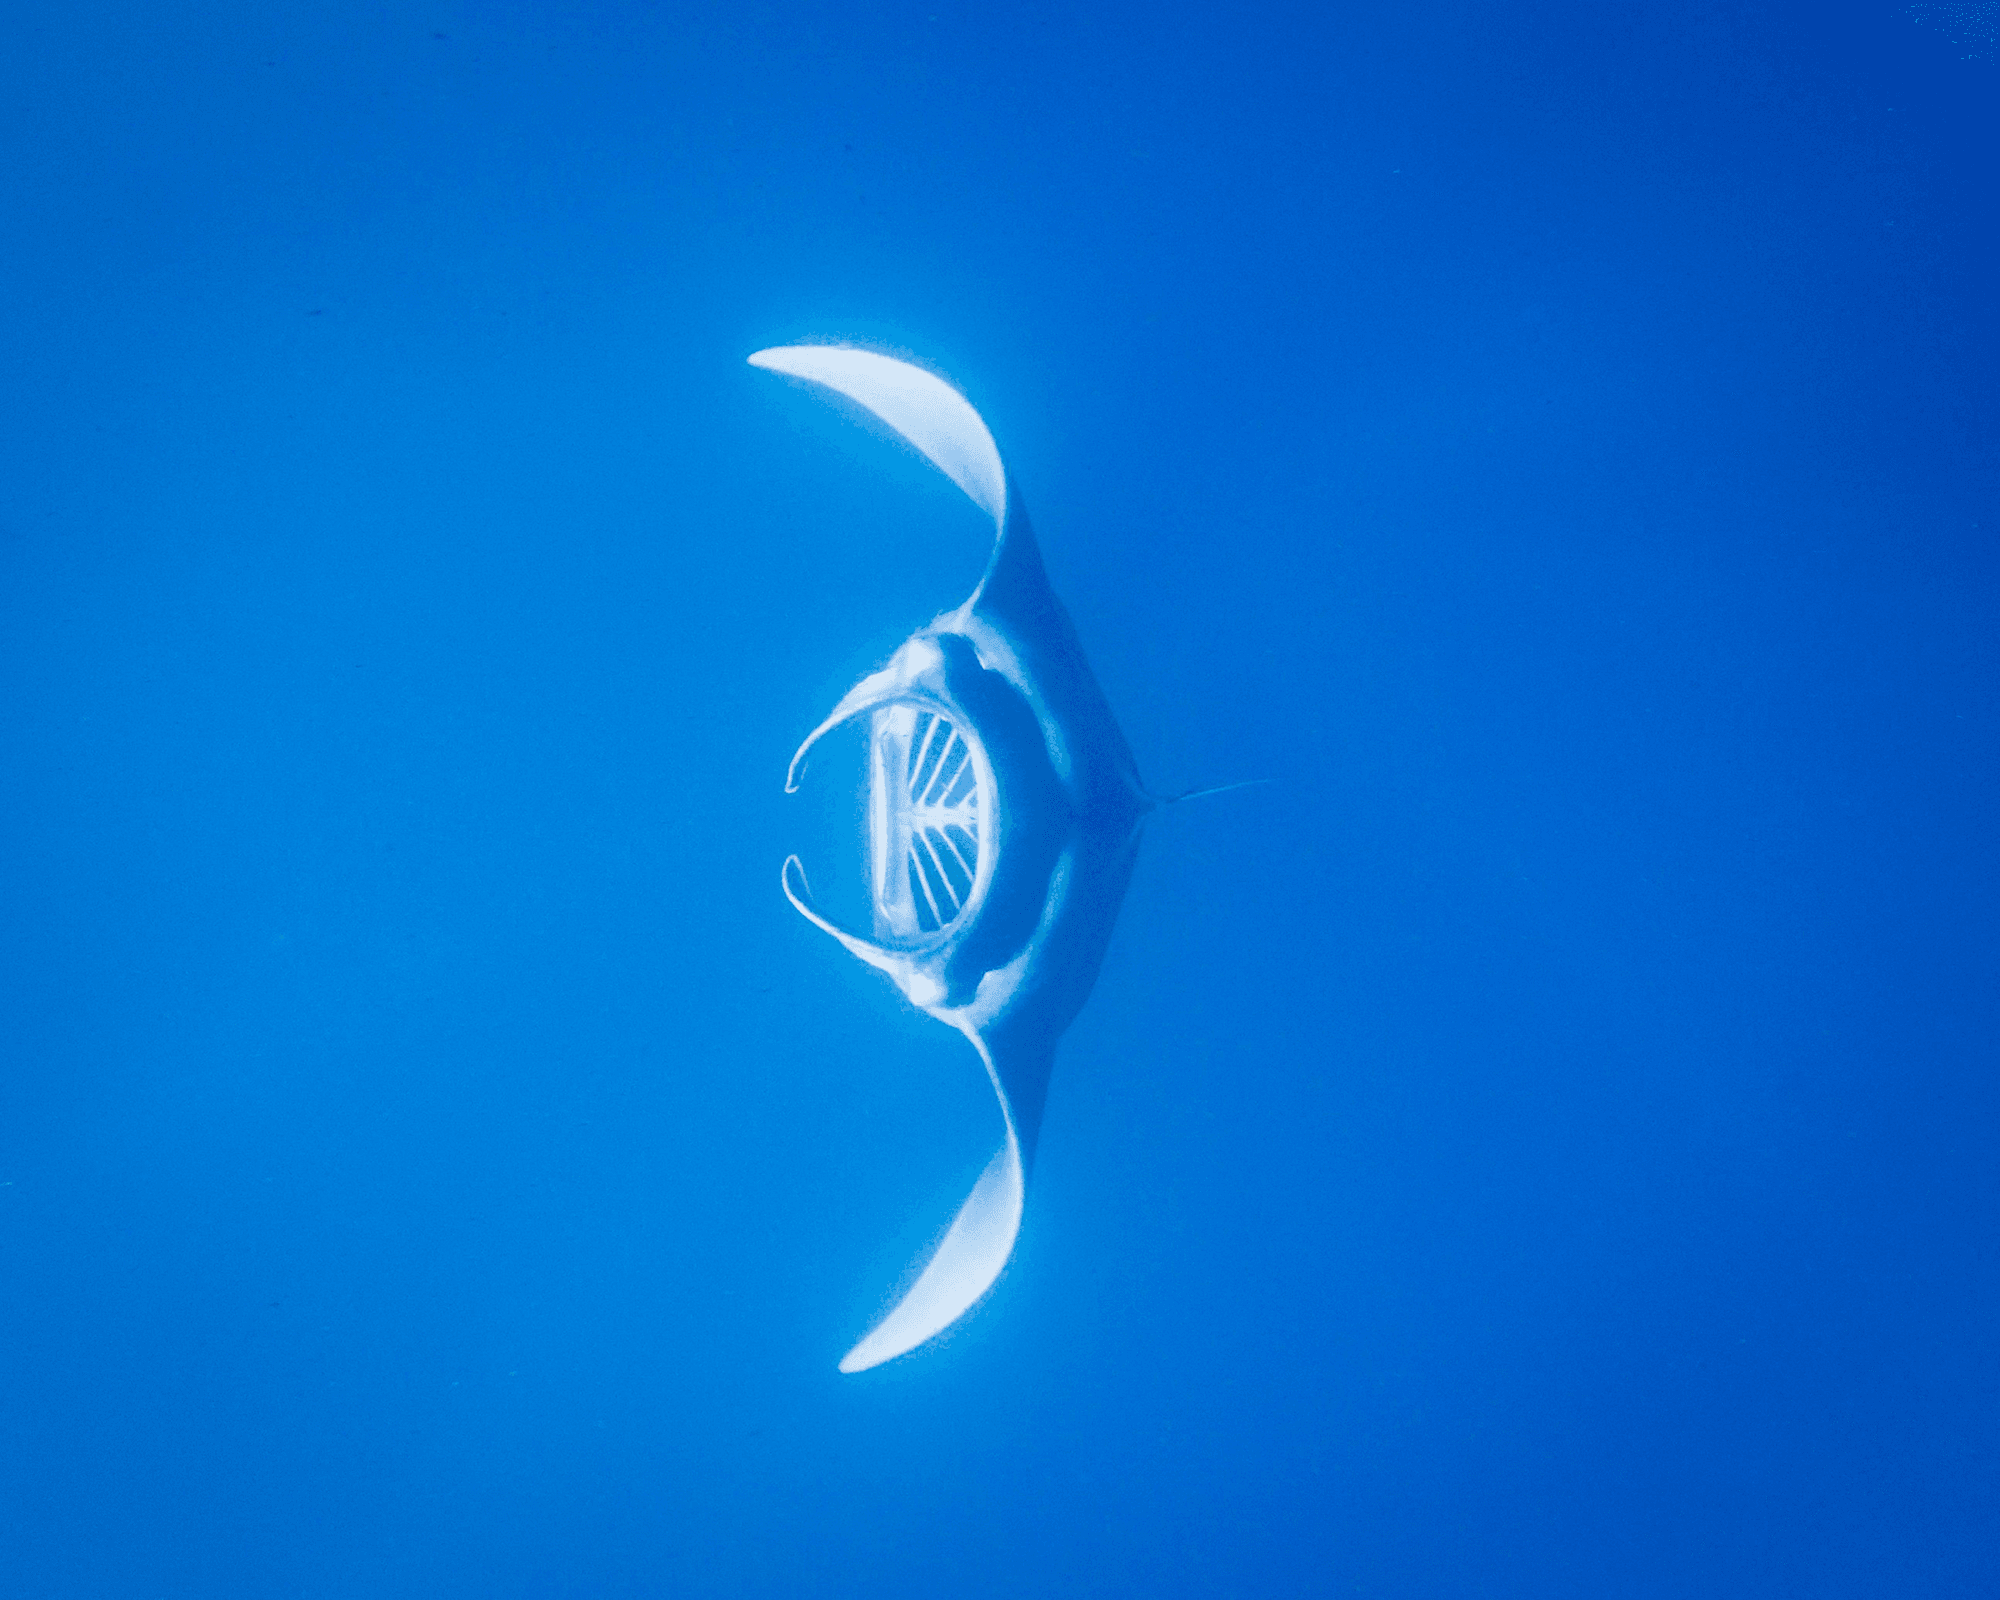
Tag: science

  • Featured Video Play Icon

    How CO2 Gets Into the Ocean

    Our oceans absorb large amounts of atmospheric carbon dioxide. Liquid water is quite good at dissolving carbon dioxide gas, which is why we have seltzer, beer, sodas, and other carbonated drinks. The larger the surface area between the atmosphere and the ocean, the more quickly carbon dioxide gets dissolved. So breaking waves — which trap lots of bubbles — are a major factor in this carbon exchange.

    This video shows off numerical simulations exploring how breaking waves and bubbly turbulence affect carbon getting into the ocean. The visualizations are gorgeous, and you can follow the problem from the large-scale (breaking waves) all the way down to the smallest scales (bubbles coalescing). (Video and image credit: S. Pirozzoli et al.)

    Fediverse Reactions
  • Flushing the Brain During Sleep

    Flushing the Brain During Sleep

    When we sleep, our brains flush out waste that builds up during our waking hours, but how this happens has been something of a mystery. A new study of sleeping mice has visualized and tracked the flow for the first time. The researchers found that, during a specific sleep phase (the non-rapid eye movement portion), the mice released pulses of norepinephrine — a cousin to adrenaline — that periodically contracted blood vessels in the rodents’ brains. As these blood vessels contract and relax, it forces the nearby cerebrospinal fluid to flow. In short, the pulsing of the blood vessels pumps the fluid bathing the brain, flushing it.

    The team also found that certain medications — like the sleep aid Ambien — disrupted this flow in mice by suppressing the blood vessels’ oscillations. It’s not known yet whether our brains operate on the same pumping principle or whether medications could affect that, but it does suggest that a similar study in humans is worthwhile. (Image credit: K. Howard; research credit: N. Hauglund et al.; via Science)

  • Featured Video Play Icon

    A Pitcher Plant’s Rain-Triggered Trap

    Pitcher plants all use slippery rims and sticky digestive juices to capture and trap their insect prey. But two species of pitcher plant independently evolved an extra trap: a rain-activated springboard lid. Both the Seychelles pitcher plant and the slender pitcher plant — separated geographically by 6000 kilometers — have a springy, near-horizontal “lid” that sticks out over their pitcher. The underside of the surface is slippery, though less so than the pitcher’s lip and walls. Unsuspecting ants crawl under the lid, confident that they can keep their footing, and then — bang — a rain drop hits the springboard. That impact catapults the insect directly into the drink. There’s no escaping now.

    How did two widely separated, independently evolving plants both settle on this technique? Scientists think it was random chance. Pitcher plants are highly variable in their pitcher size, shape, and features. The scientists suggest that by trying lots of random combinations, these two species hit upon a particular arrangement that works really well for them. (Video and image credit: Science)

    Fediverse Reactions
  • “Waterfall Wonder”

    “Waterfall Wonder”

    The Semeru volcano rises in the background of this photo of Java’s Tumpak Sewa waterfall by Joan de la Malla. Rain that falls on the volcano slides down its flank and wanders through the jungle on its way to the spectacular 120-meter-high waterfall. From the clouds wreathing the mountain through the jungle’s drifting fogs to the mists of the falls, this portrait highlights the many forms water takes on its journey. (Image credit: J. de la Malla/WPOTY; via Colossal)

  • Peering Inside a Hailstone

    Peering Inside a Hailstone

    In spring and summer, major thunderstorms can include dangerous and destructive hailstones. In Catalonia, a group of scientists collected hailstones after a record-breaking 2022 storm, finding some as large as 12 centimeters across. Using a dentist’s CT scanner, they looked at the interior of the hailstones, uncovering layers that reveal how the hail grew. In the past, researchers have studied hail by slicing the ice; that method gives them only a single cross-section through the hailstone, which gets destroyed in the process. In contrast, a CT scan revealed the full interior of the ice.

    The scientists found that, even though hail often appears spherical, the nucleus of the hail is not always located in the center. They saw that the hail grew in uneven layers that varied in density, depending on the storm conditions the hail experienced. To get to the enormous sizes seen here, hailstones have to travel up and down repeatedly through a storm, building up layer by layer. From the hail’s interior structure, the team could also tell what orientation the hail took its final fall in; the ice along the bottom of the hailstone was bubble-free, indicating that it collected as water drops hit the surface and froze. (Image credit: T. Ribas; research credit: C. Barqué et al.; via New Scientist)

    Fediverse Reactions
  • Instabilities in Competition

    Instabilities in Competition

    When two liquid jets collide, they form a thin liquid sheet with a thicker rim. That rim breaks into threads and then droplets, forming a well-known fishbone pattern as the Plateau-Rayleigh instability breaks up the flow. This poster shows a twist on that set-up: here, the two colliding jets vary slightly in their velocities. That variability adds a second instability to the system, visible as the wavy pattern on the central liquid sheet. The sheet’s rim still breaks apart in the usual fishbone pattern, but the growing waves in the center of the sheet eventually that structure apart as well. (Image credit: S. Dighe et al.)

    Fediverse Reactions
  • Flow Behind Viscous Fingers

    Flow Behind Viscous Fingers

    Nature is full of branching patterns: trees, lighting, rivers, and more. In fluid dynamics, our prototypical branching pattern is the Saffman-Taylor instability, created when a less viscous fluid is injected into a more viscous one in an confined space. Most attention in this problem has gone to the branching interface where the two fluids meet, but recently, a team has examined the flow away from the fingers by alternately injecting dyed and undyed fluid to visualize what goes on. That’s what we see here. Notice how the central dye rings, far from the branching fingers, still appear circular. Yet, even a few centimeters away from the fingers, the dye is starting to show ripples that correspond to the fingers. That’s an indication that the pressure gradient generated at the tips of the fingers is pretty far-reaching! (Image and research credit: S. Gowen et al.)

    Fediverse Reactions
  • Featured Video Play Icon

    Mapping the Oceans With Seals

    Elephant seals are harbingers — canaries in the coal mine — for climate change. A long-running experiment tracks northern elephant seal populations using a combination of sensor tags and field measurements. With the miniaturization of sensors, a tagged seal can provide a wealth of data for scientists: foraging paths, temperature and salinity data, behavioral patterns, ecological data, and even information on the species around the seal. This video delves into this treasure trove, explaining how and what we’re learning from this species, especially as they navigate our changing climate. (Video and image credit: Science)

    Fediverse Reactions
  • Bubbling Up

    Bubbling Up

    By volume, Lake Baikal is the world’s largest lake, holding over 20% of the planet’s fresh water. It’s also a major carbon sink, holding large amounts of methane. That’s the gas trapped in the frozen bubbles seen here. Baikal’s ice is exceptionally clear, making long trails of frozen bubbles visible during the winter. (Image credit: K. Makeeva; via APOD)

    Fediverse Reactions
  • Tracking Meltwater Through Flex

    Tracking Meltwater Through Flex

    Greenland’s ice sheet holds enough water to raise global sea levels by several meters. Each year meltwater from the sheet percolates through the ice, filling hidden pools and crevasses on its way to draining into the sea. Monitoring this journey directly is virtually impossible; too much goes on deep below the surface and the ice sheet is a precarious place for scientists to operate. So, instead, they’re monitoring the bedrock nearby.

    Researchers used a network of Global Navigation Satellite System (GNSS) stations like the one above to track how the ground shifted and flexed as meltwater collected and moved. They found that the bedrock moved as much as 5 millimeters during the height of the summer melt. How quickly the ground relaxed back to its normal state depended on where the water went and how quickly it moved. Their results indicate that the water’s journey is not a short one: meltwater spends months collecting in subterranean pools on its way to the ocean — something that current climate models don’t account for. Overall, the team’s results indicate that there’s much more hidden meltwater than models predict and it spends a few months under the ice on its way to the sea. (Image credit: T. Nylen; research credit: J. Ran et al.; via Eos)

    Fediverse Reactions