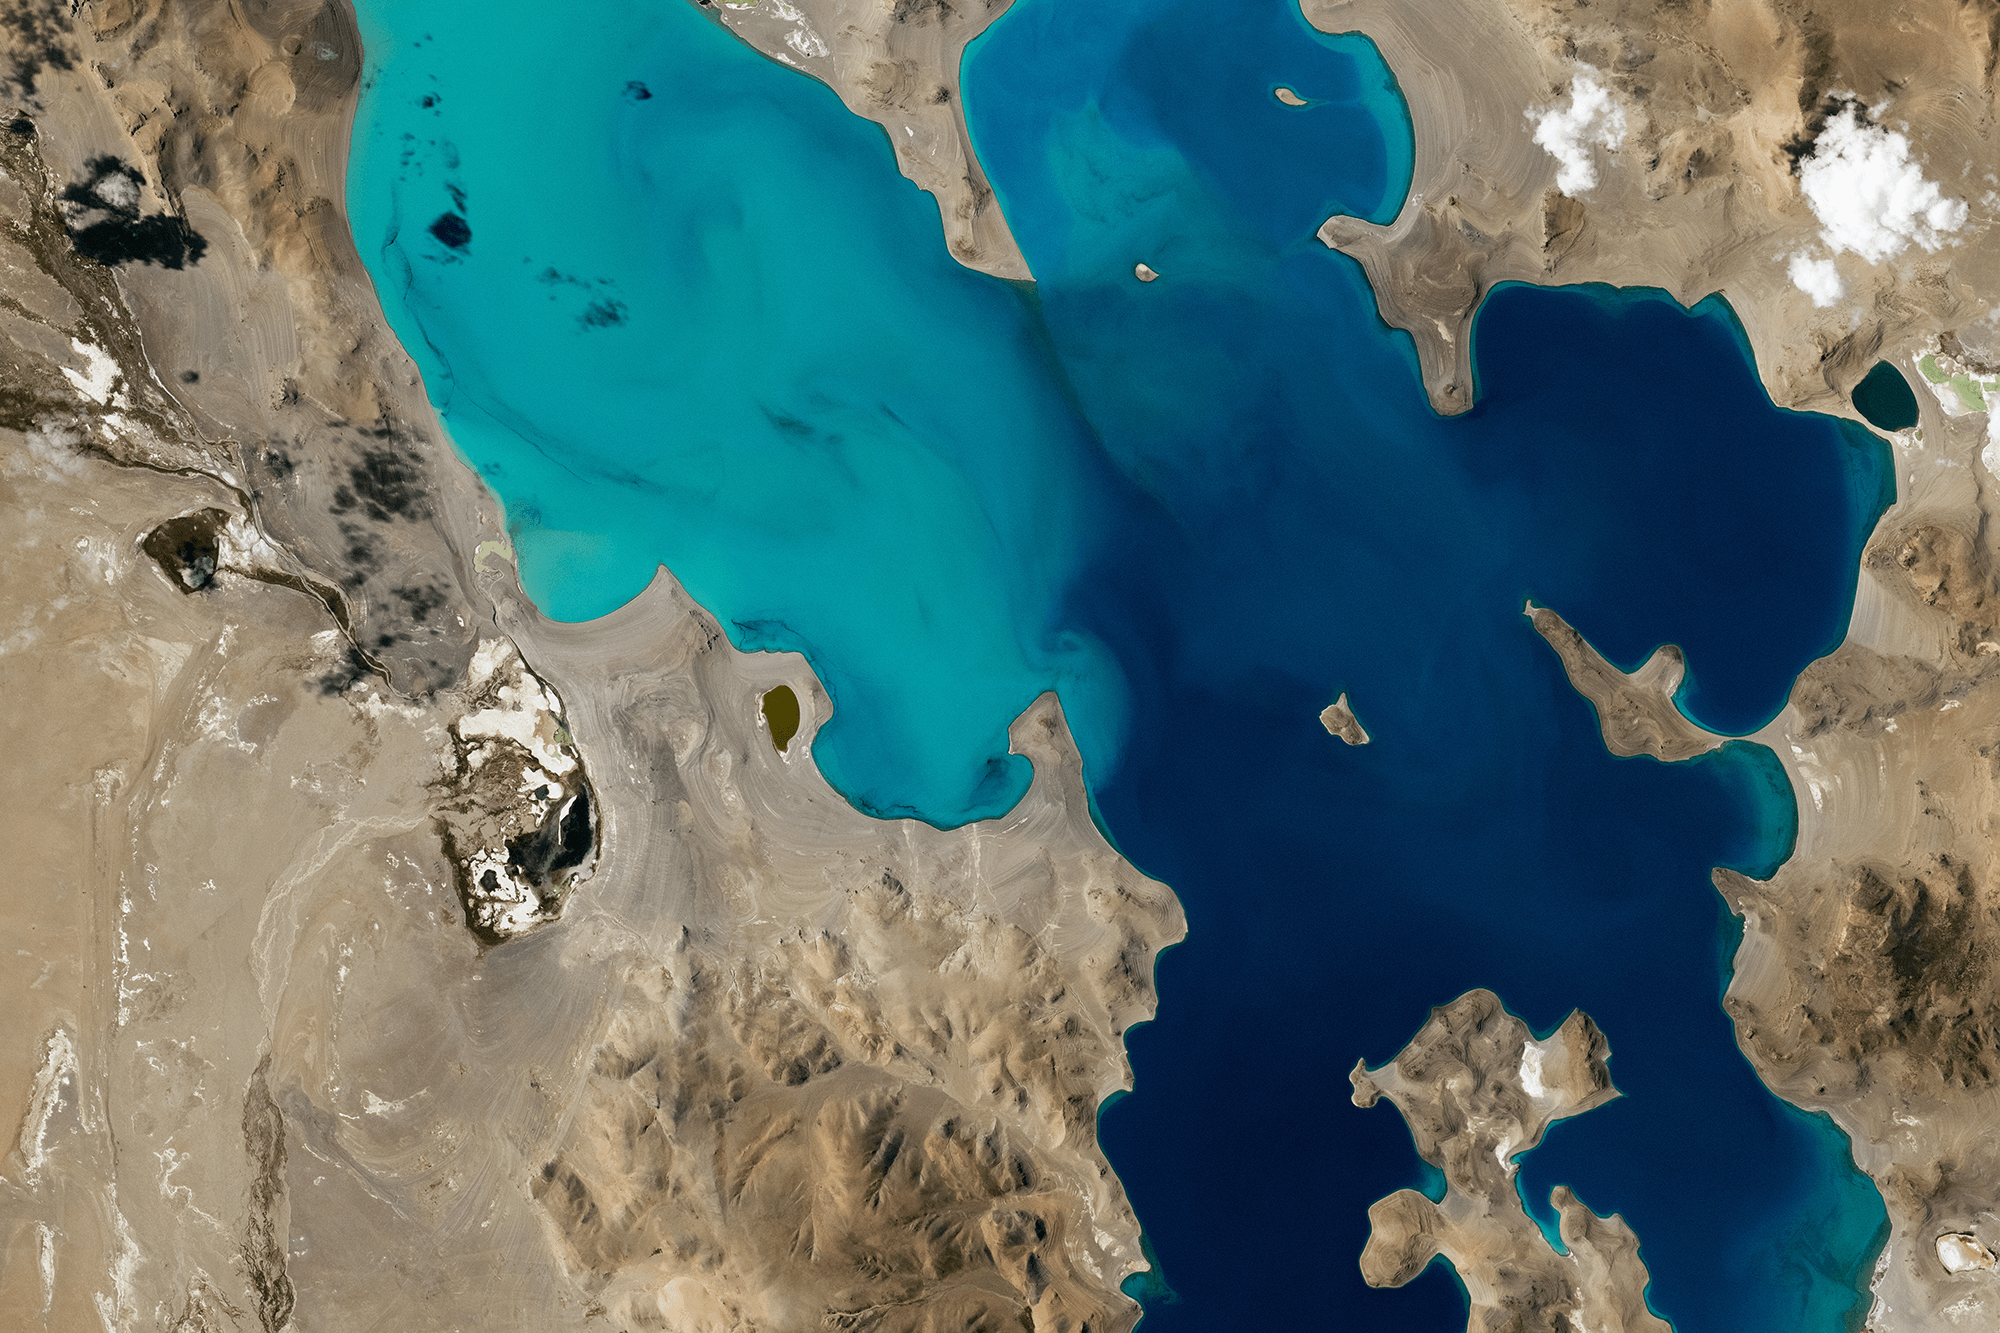
Ngangla Ringco sits atop the Tibetan Plateau, breaking up the barren landscape with eye-catching teal and blue. This saline lake sits at an altitude of 4,700 meters, fed by rainfall, Himalayan runoff, and melting glaciers and permafrost. The lake, like many inland bodies of salt water, has no outflow. Instead, water evaporates from the lake, leaving behind any salts that were dissolved in it. Over time, those left-behind salts build up and make the lake ever saltier. (Image credit: NASA; via NASA Earth Observatory)
Tag: satellite image

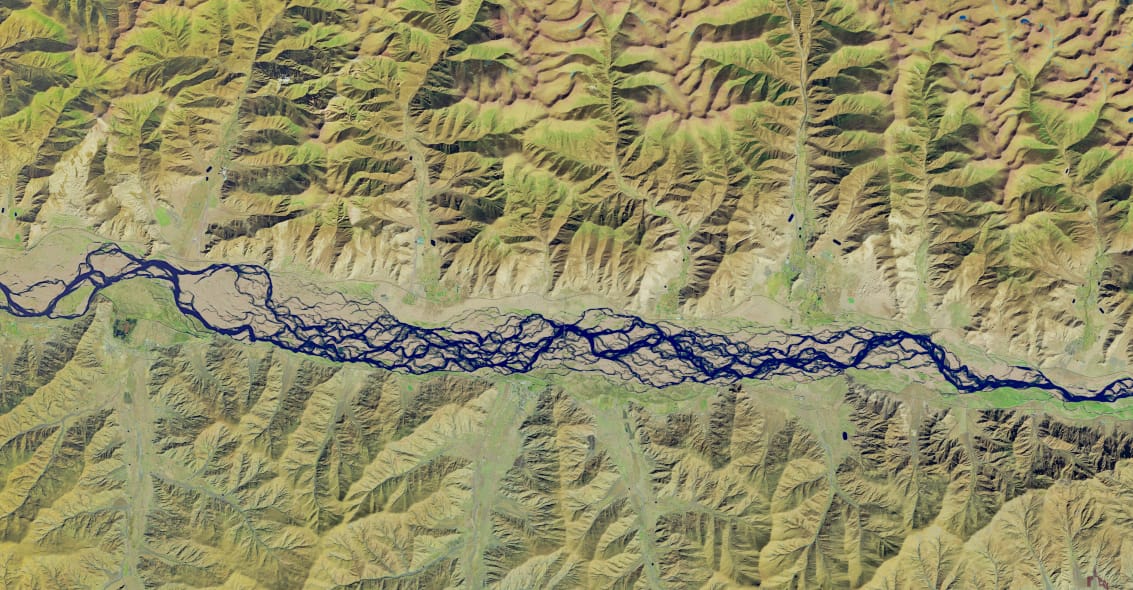
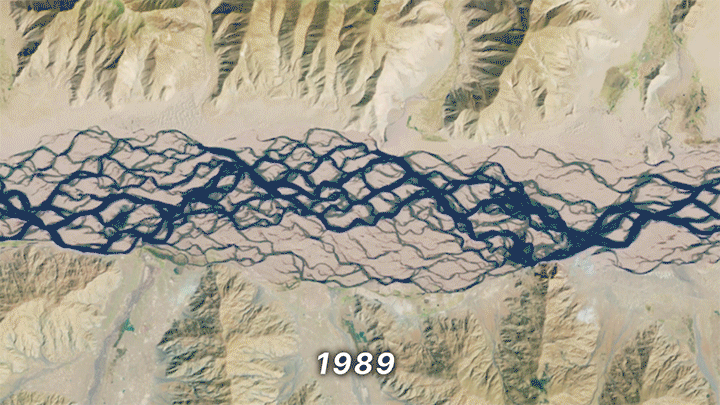
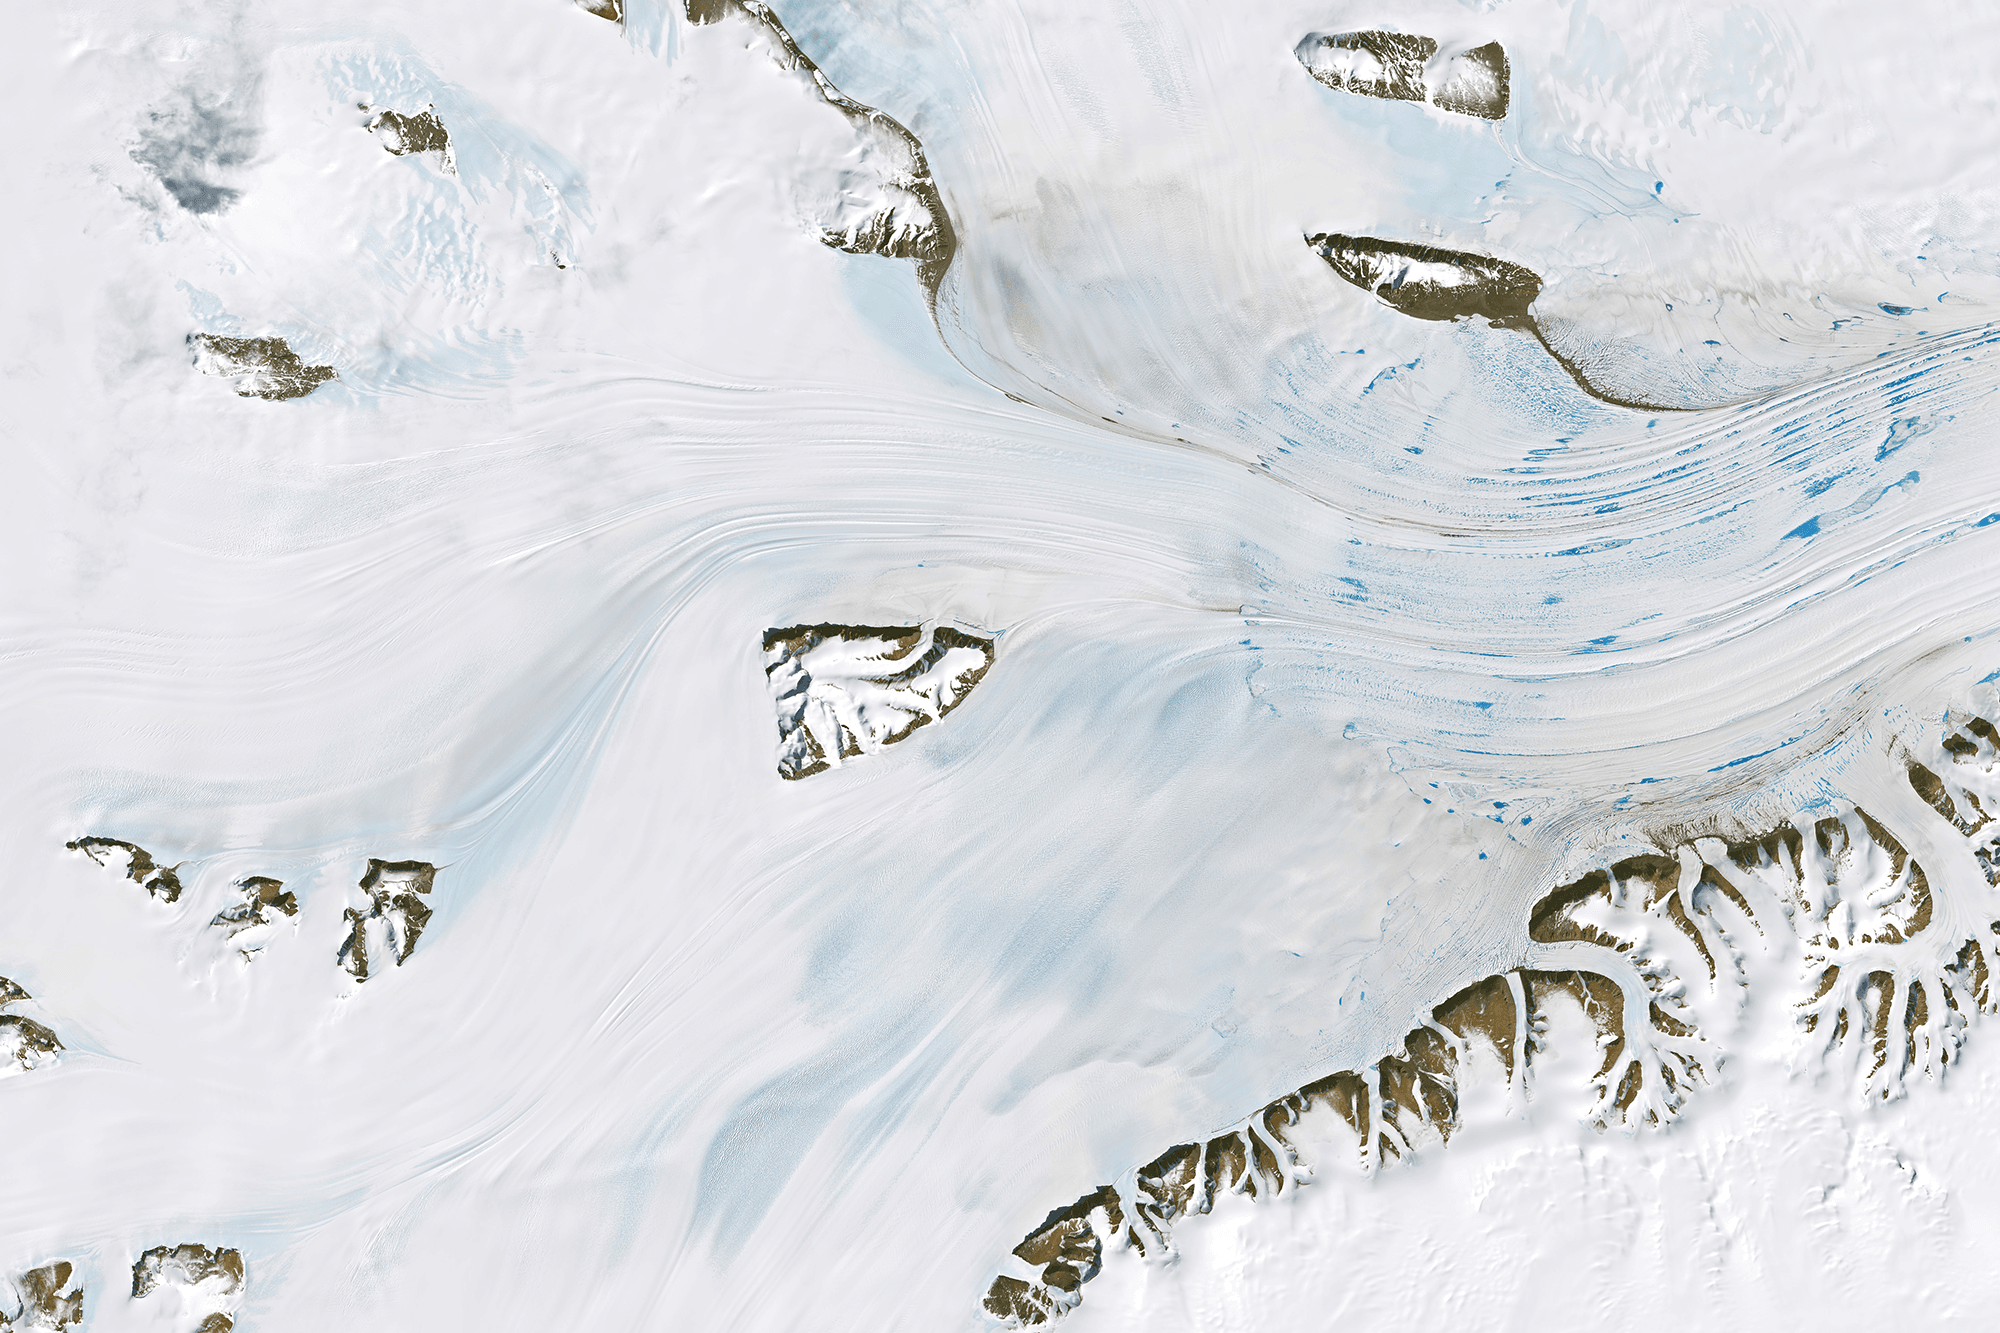
A Braided River
The Yarlung Zangbo River winds through Tibet as the world’s highest-altitude major river. Parts of it cut through a canyon deeper than 6,000 meters (three times the depth of the Grand Canyon). And other parts, like this section, are braided, with waterways that shift rapidly from season to season. The swift changes in a braided river’s sandbars come from large amounts of sediment eroded from steep mountains upstream. As that sediment sweeps downstream, some will deposit, which narrows channels and can increase their scouring. The river’s shape quickly becomes a complicated battle between sediment, flow speed, and slope. (Image credit: M. Garrison; animation credit: R. Walter; via NASA Earth Observatory)

Fediverse Reactions
-

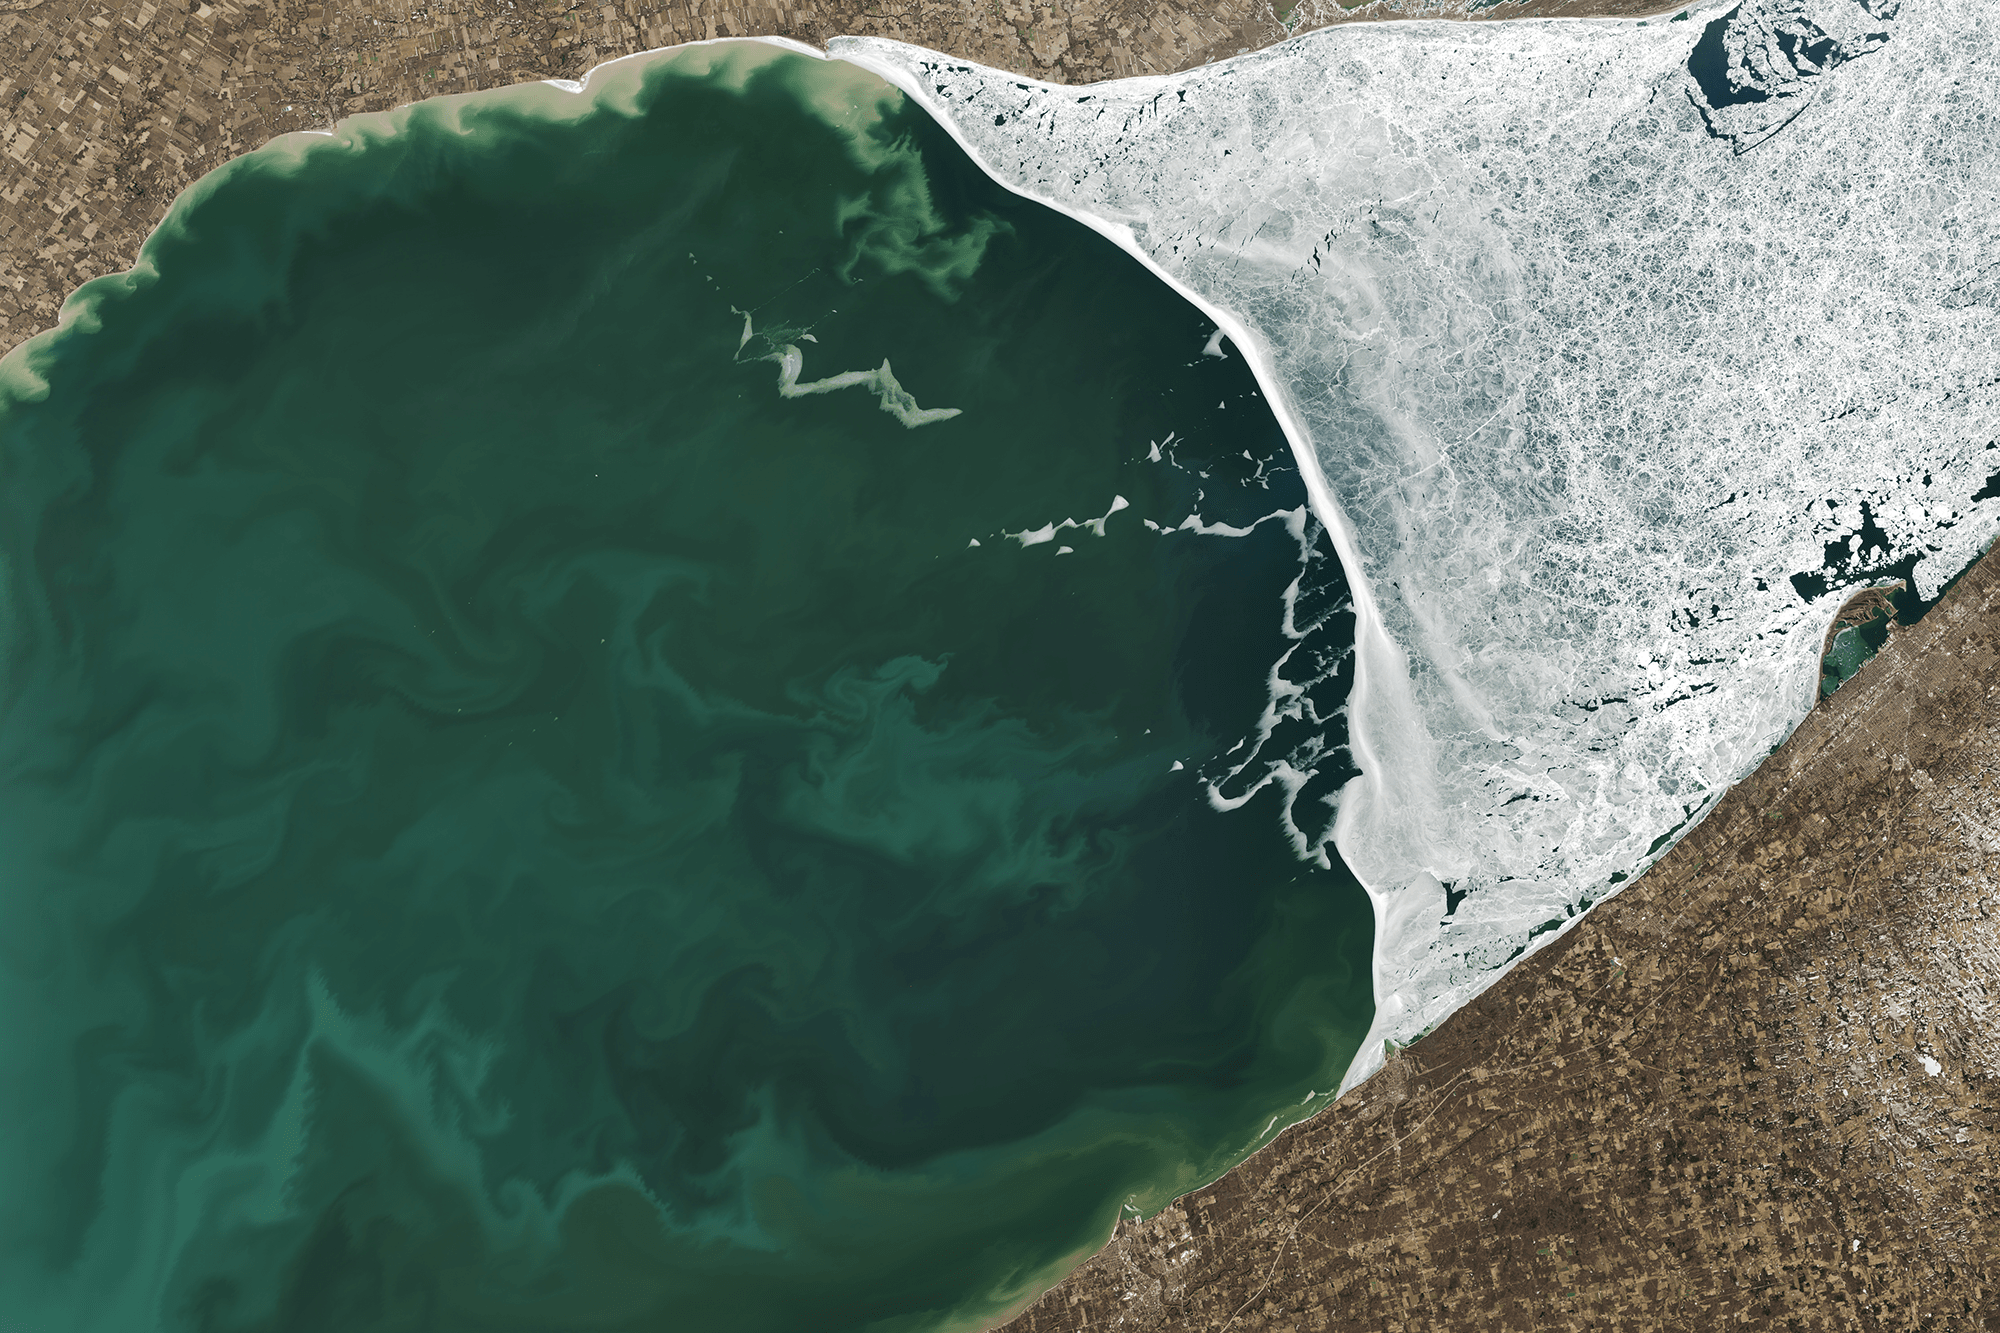
Thawing Out
Lake Erie, the shallowest of the Great Lakes, can almost completely freeze over in winter. In this satellite image of the lake in March 2025, about a third of the lake remains ice-covered, while sediment — resuspended by wind and currents — and phytoplankton swirl in the ice-free zone. In recent decades, scientists discovered that diatoms, one of the phytoplankton groups found in the lake, can live within and just below Erie’s ice, thanks to a symbiotic relationship with an ice-loving bacteria. This symbiosis allows the diatoms to attach to the underside of the ice and gather the light needed for photosynthesis. Even in the depths of winter, an ice-covered lake can teem with life. (Image credit: M. Garrison; via NASA Earth Observatory)
Fediverse Reactions
-

Baltic Bloom
June and July brings blooming phytoplankton to the Baltic Sea, seen here in late July 2025. On-the-water measurements show that much of this bloom was cyanobacteria, an ancient type of organism among the first to process carbon dioxide into oxygen. These organisms thrive in nutrient- and nitrogen-rich waters. Here, they mark out the tides and currents that mix the Baltic. Zoom in on the full image, and you’ll see dark, nearly-straight lines across the swirls; these are the wakes of boats. (Image credit: M. Garrison; via NASA Earth Observatory)
Fediverse Reactions
-

A Variety of Vortices
Winds parted around the Kuril Islands and left behind a string of vortices in this satellite image from April 2025. This pattern of alternating vortices is known as a von Karman vortex street. The varying directions of the vortex streets show that winds across the islands ranged from southeasterly to southerly. Notice also that the size of the island dictates the size of the vortices. Larger islands create larger vortices, and smaller islands have smaller and more frequent vortices. (Image credit: M. Garrison; via NASA Earth Observatory)
Fediverse Reactions
-

Capturing River Waves
Rainfall, ice jams, and dam breaks create surges of high flow that make their way down a river in a wave that stretches tens to thousands of kilometers in length. Traditionally, scientists monitor such flow waves using river gauges, which measure river height at specific locations. But gauges are few and far between on many rivers, so a group of researchers are supplementing that data with the SWOT (Surface Water and Ocean Topography) spacecraft. SWOT bounces microwaves off the water to precisely measure the water’s height, giving researchers a glimpse of the flow wave’s shape along the entire river.
In their paper, the team identify and describe flow waves on three different rivers — the Yellowstone, Colorado, and Ocmulgee rivers — ranging in height up to 9 meters and stretching up to 400 kilometers. (Image credit: CNES; research credit: H. Thurman et al.; via Gizmodo)
Fediverse Reactions
-

South Island Sediments
In April and May late autumn storms ripped through Aotearoa New Zealand. This image shows the central portion of South Island, where coastal waters are unusually bright thanks to suspended sediment. We typically think of storm run-off as water, but these flows can carry lots of sediment as well. Here, the large amount of sediment is likely a combination of increased run-off from rivers and coastal sediment stirred up by faster river flows. (Image credit: W. Liang; via NASA Earth Observatory)
Fediverse Reactions
-
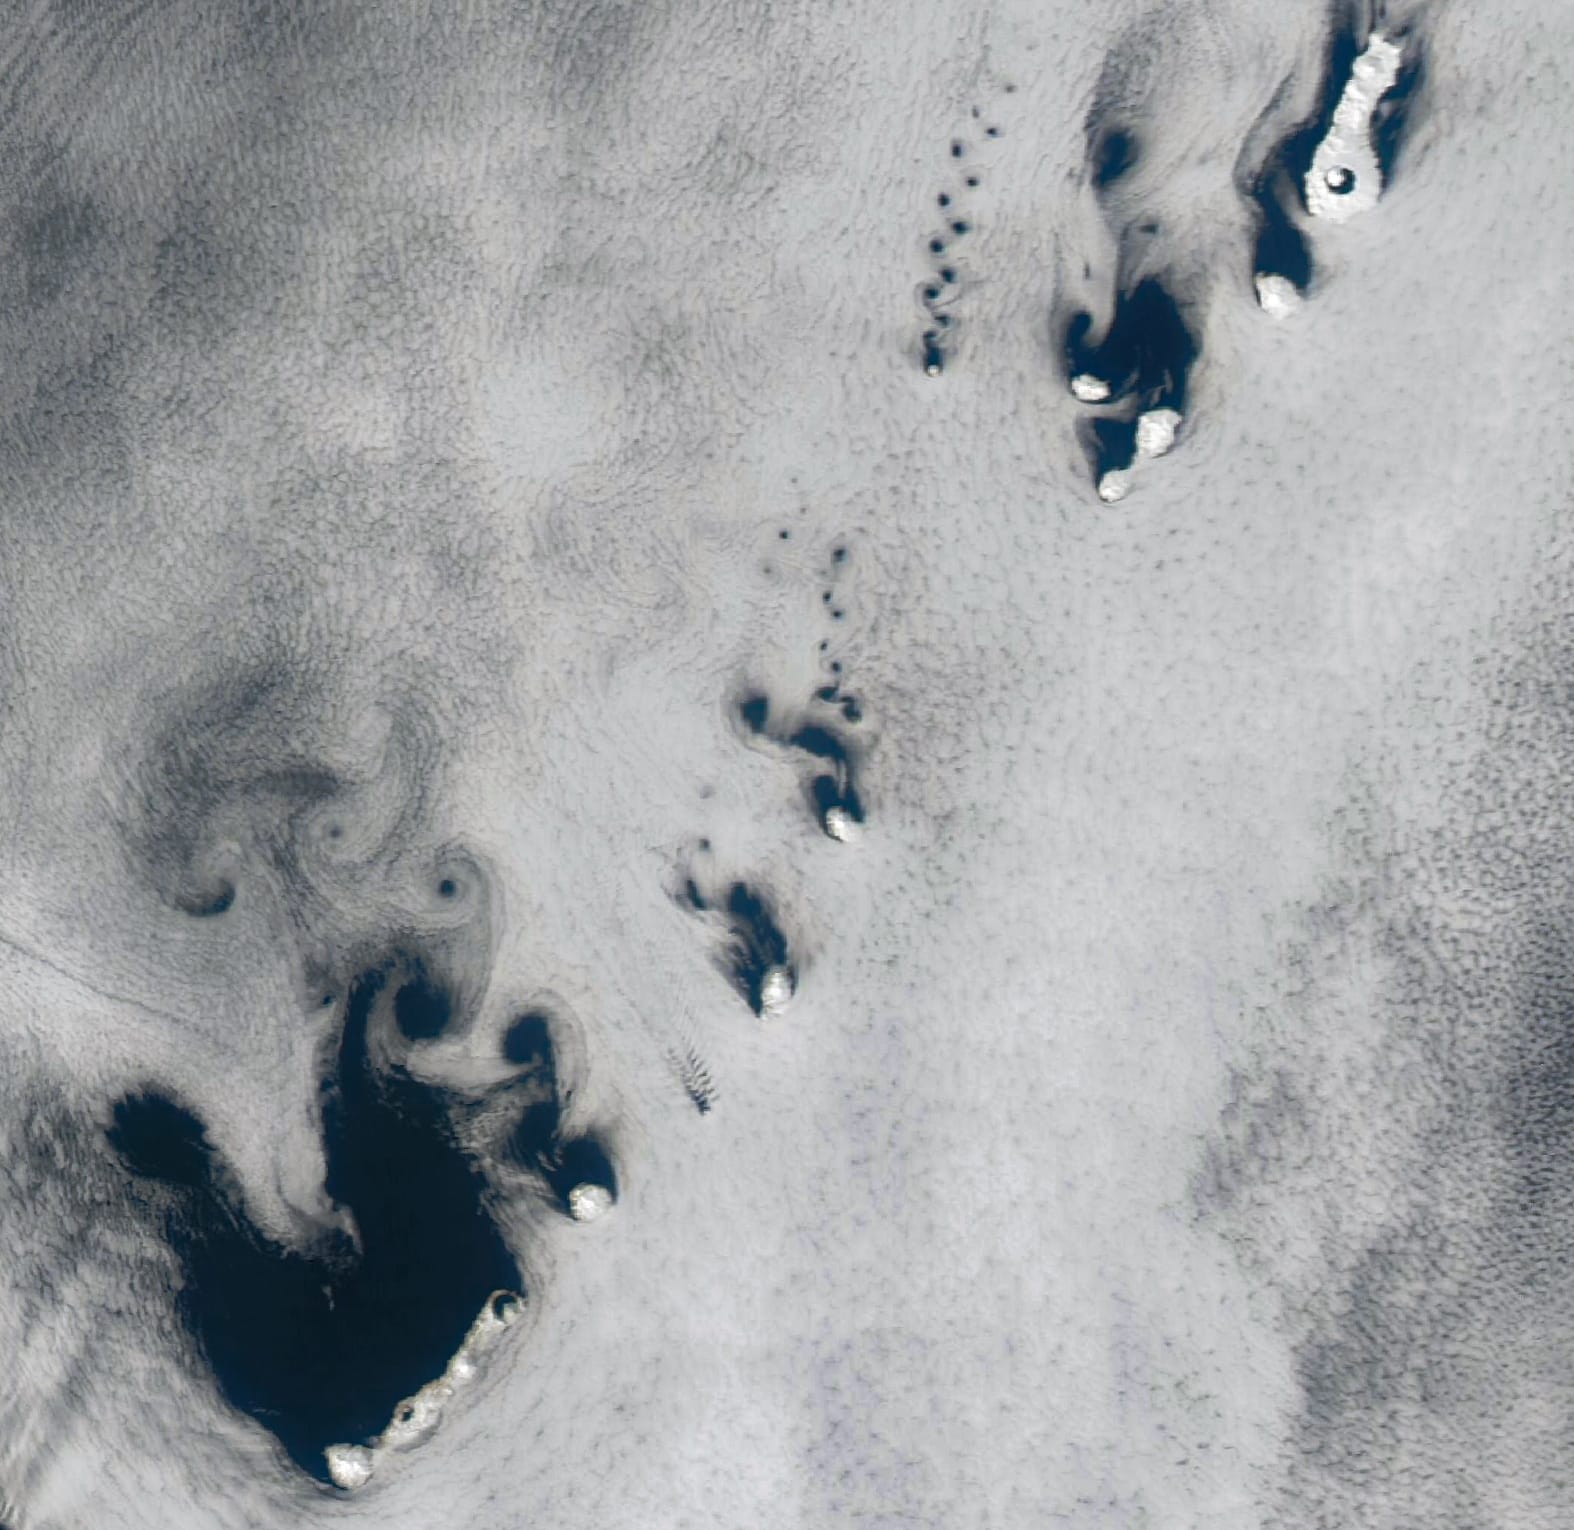
Ponding on the Ice Shelf
Glaciers flow together and march out to sea along the Amery Ice Shelf in this satellite image of Antarctica. Three glaciers — flowing from the top, left, and bottom of the image — meet just to the right of center and pass from the continental bedrock onto the ice-covered ocean. The ice shelf is recognizable by its plethora of meltwater ponds, which appear as bright blue areas. Each austral summer, meltwater gathers in low-lying regions on the ice, potentially destabilizing the ice shelf through fracture and drainage. This region near the ice shelf’s grounding line is particularly prone to ponding. Regions further afield (right, beyond the image) are colder and drier, often allowing meltwater to refreeze. (Image credit: W. Liang; via NASA Earth Observatory)
Fediverse Reactions
-

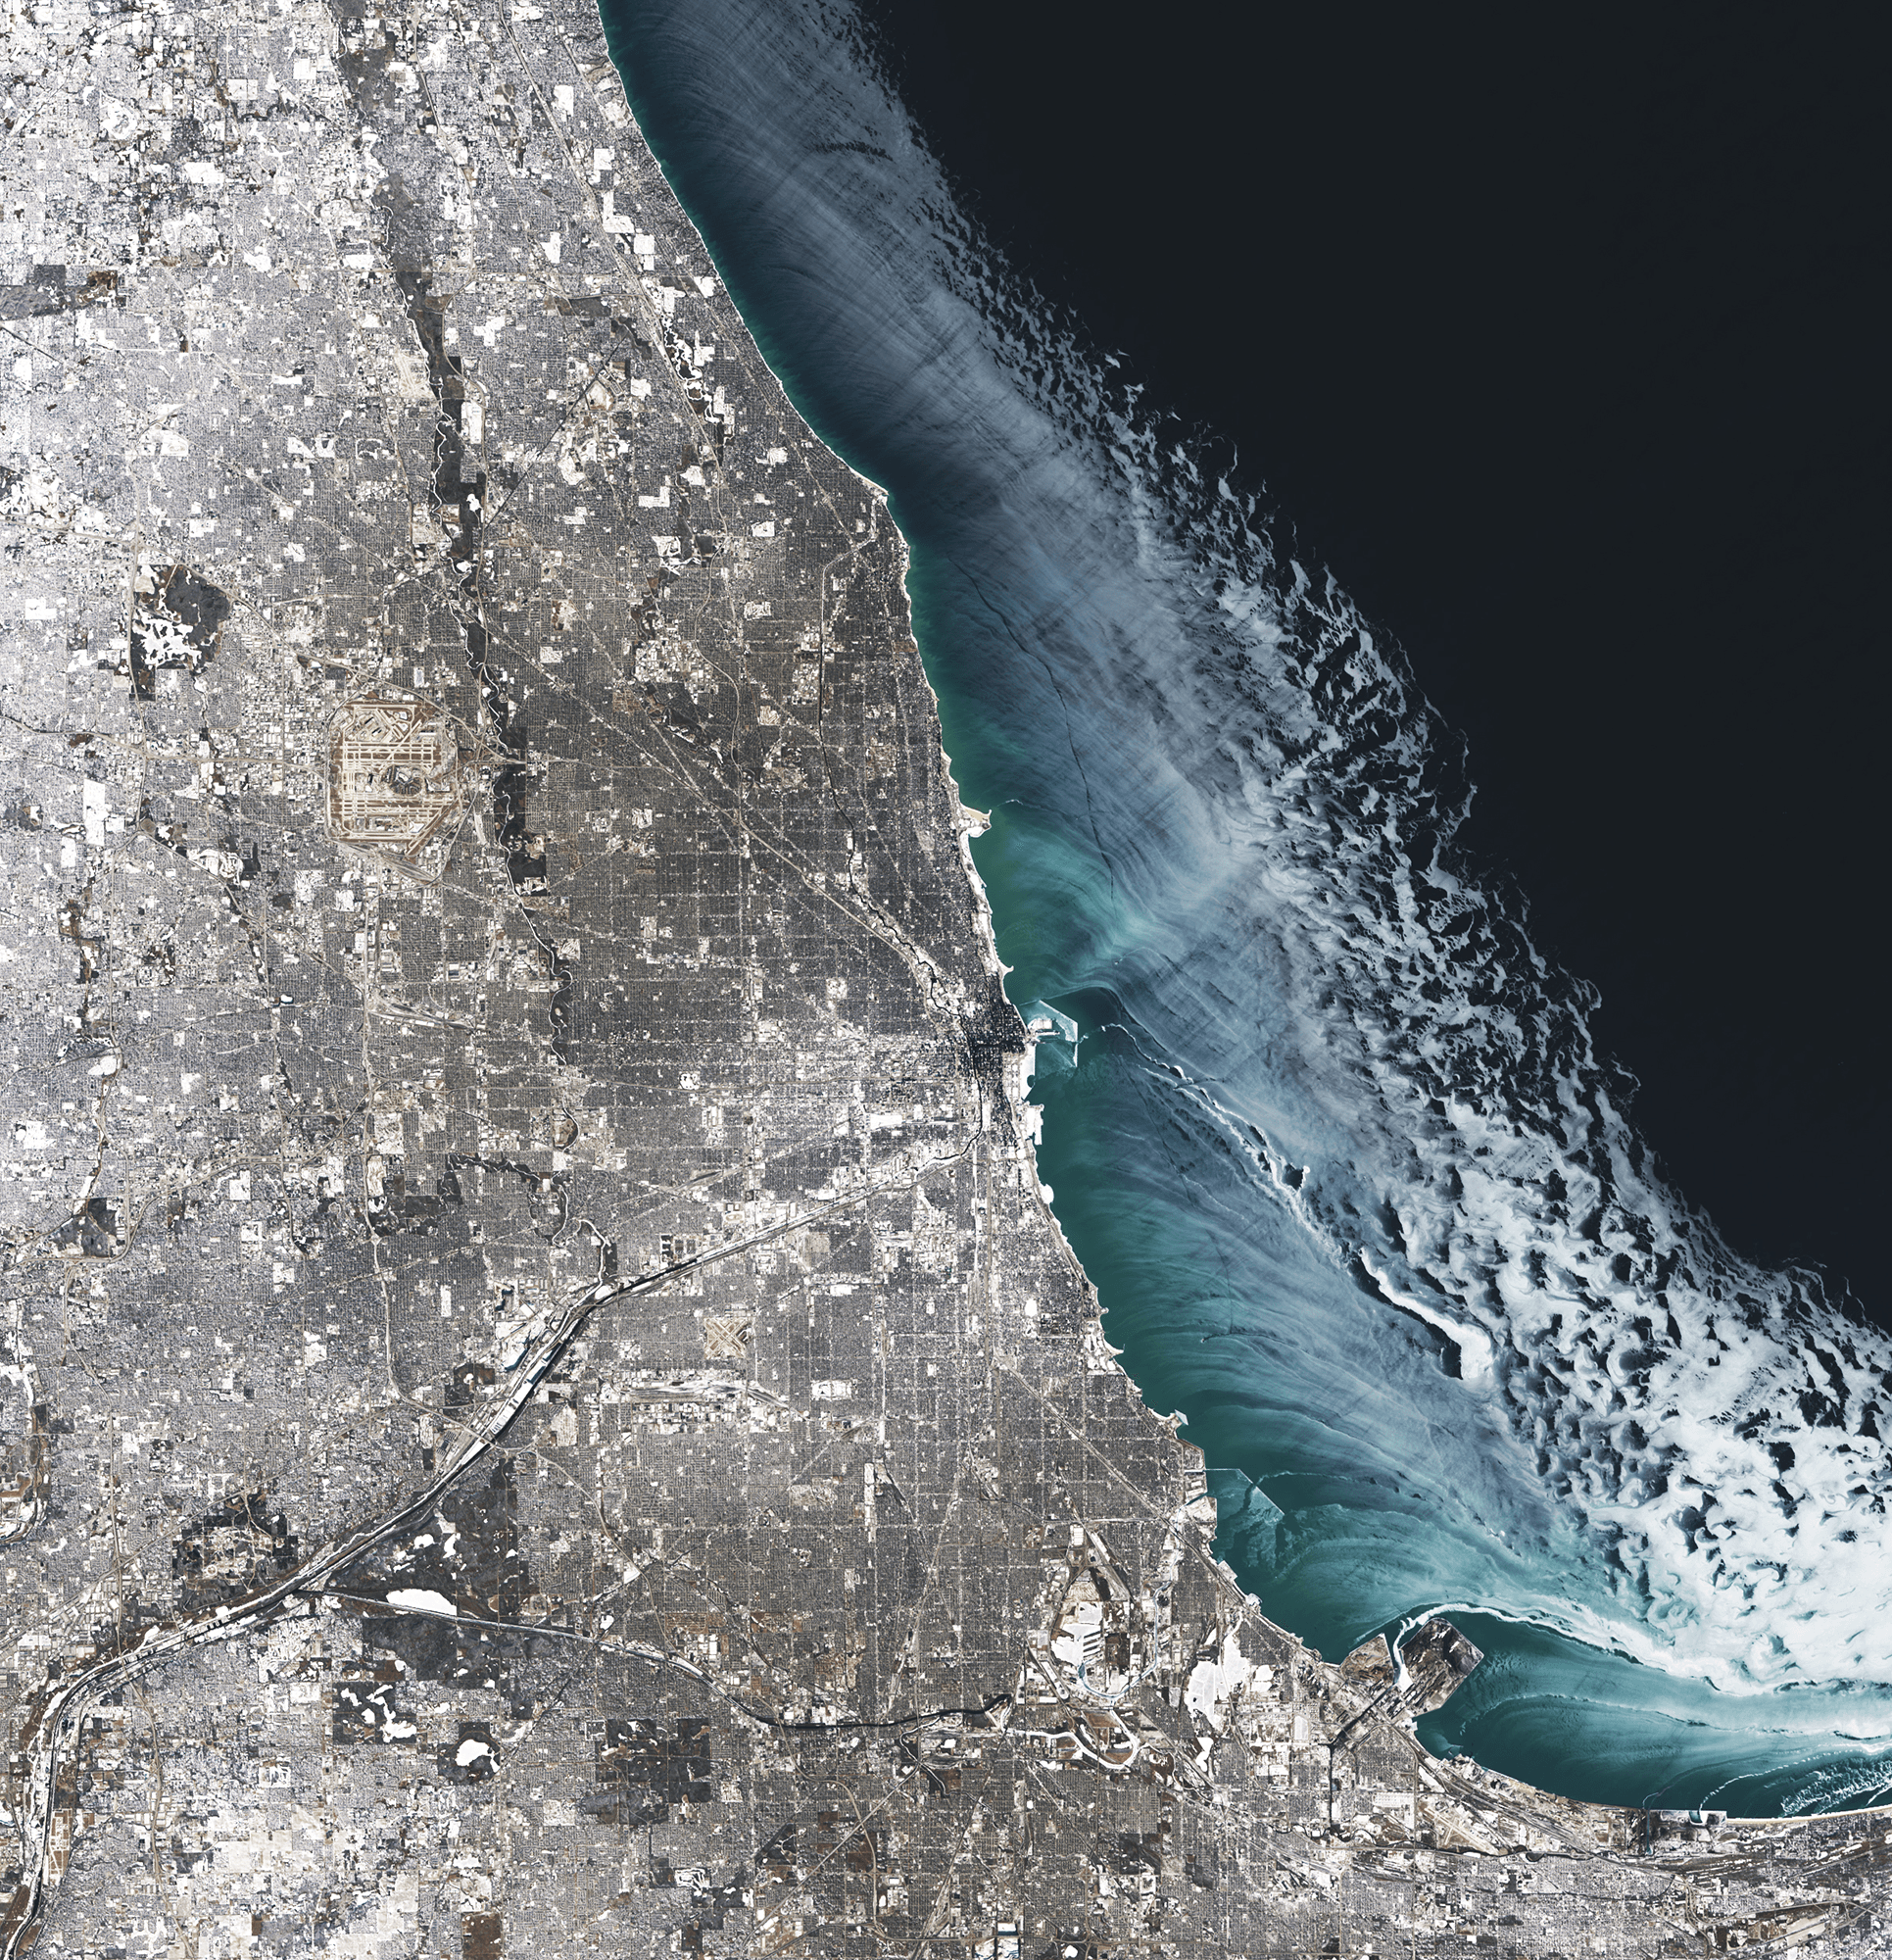
Winter in Chicago
Fresh winter snow blankets Chicago in this satellite image. Over on Lake Michigan, ice dots the coastline out to about 20 kilometers from shore. Darker regions near land mark thinner ice being pushed outward by the wind. Further out, the ice appears white and may be thicker thanks to wind-driven ice piling up. (Image credit: M. Garrison; via NASA Earth Observatory)
Fediverse Reactions
-

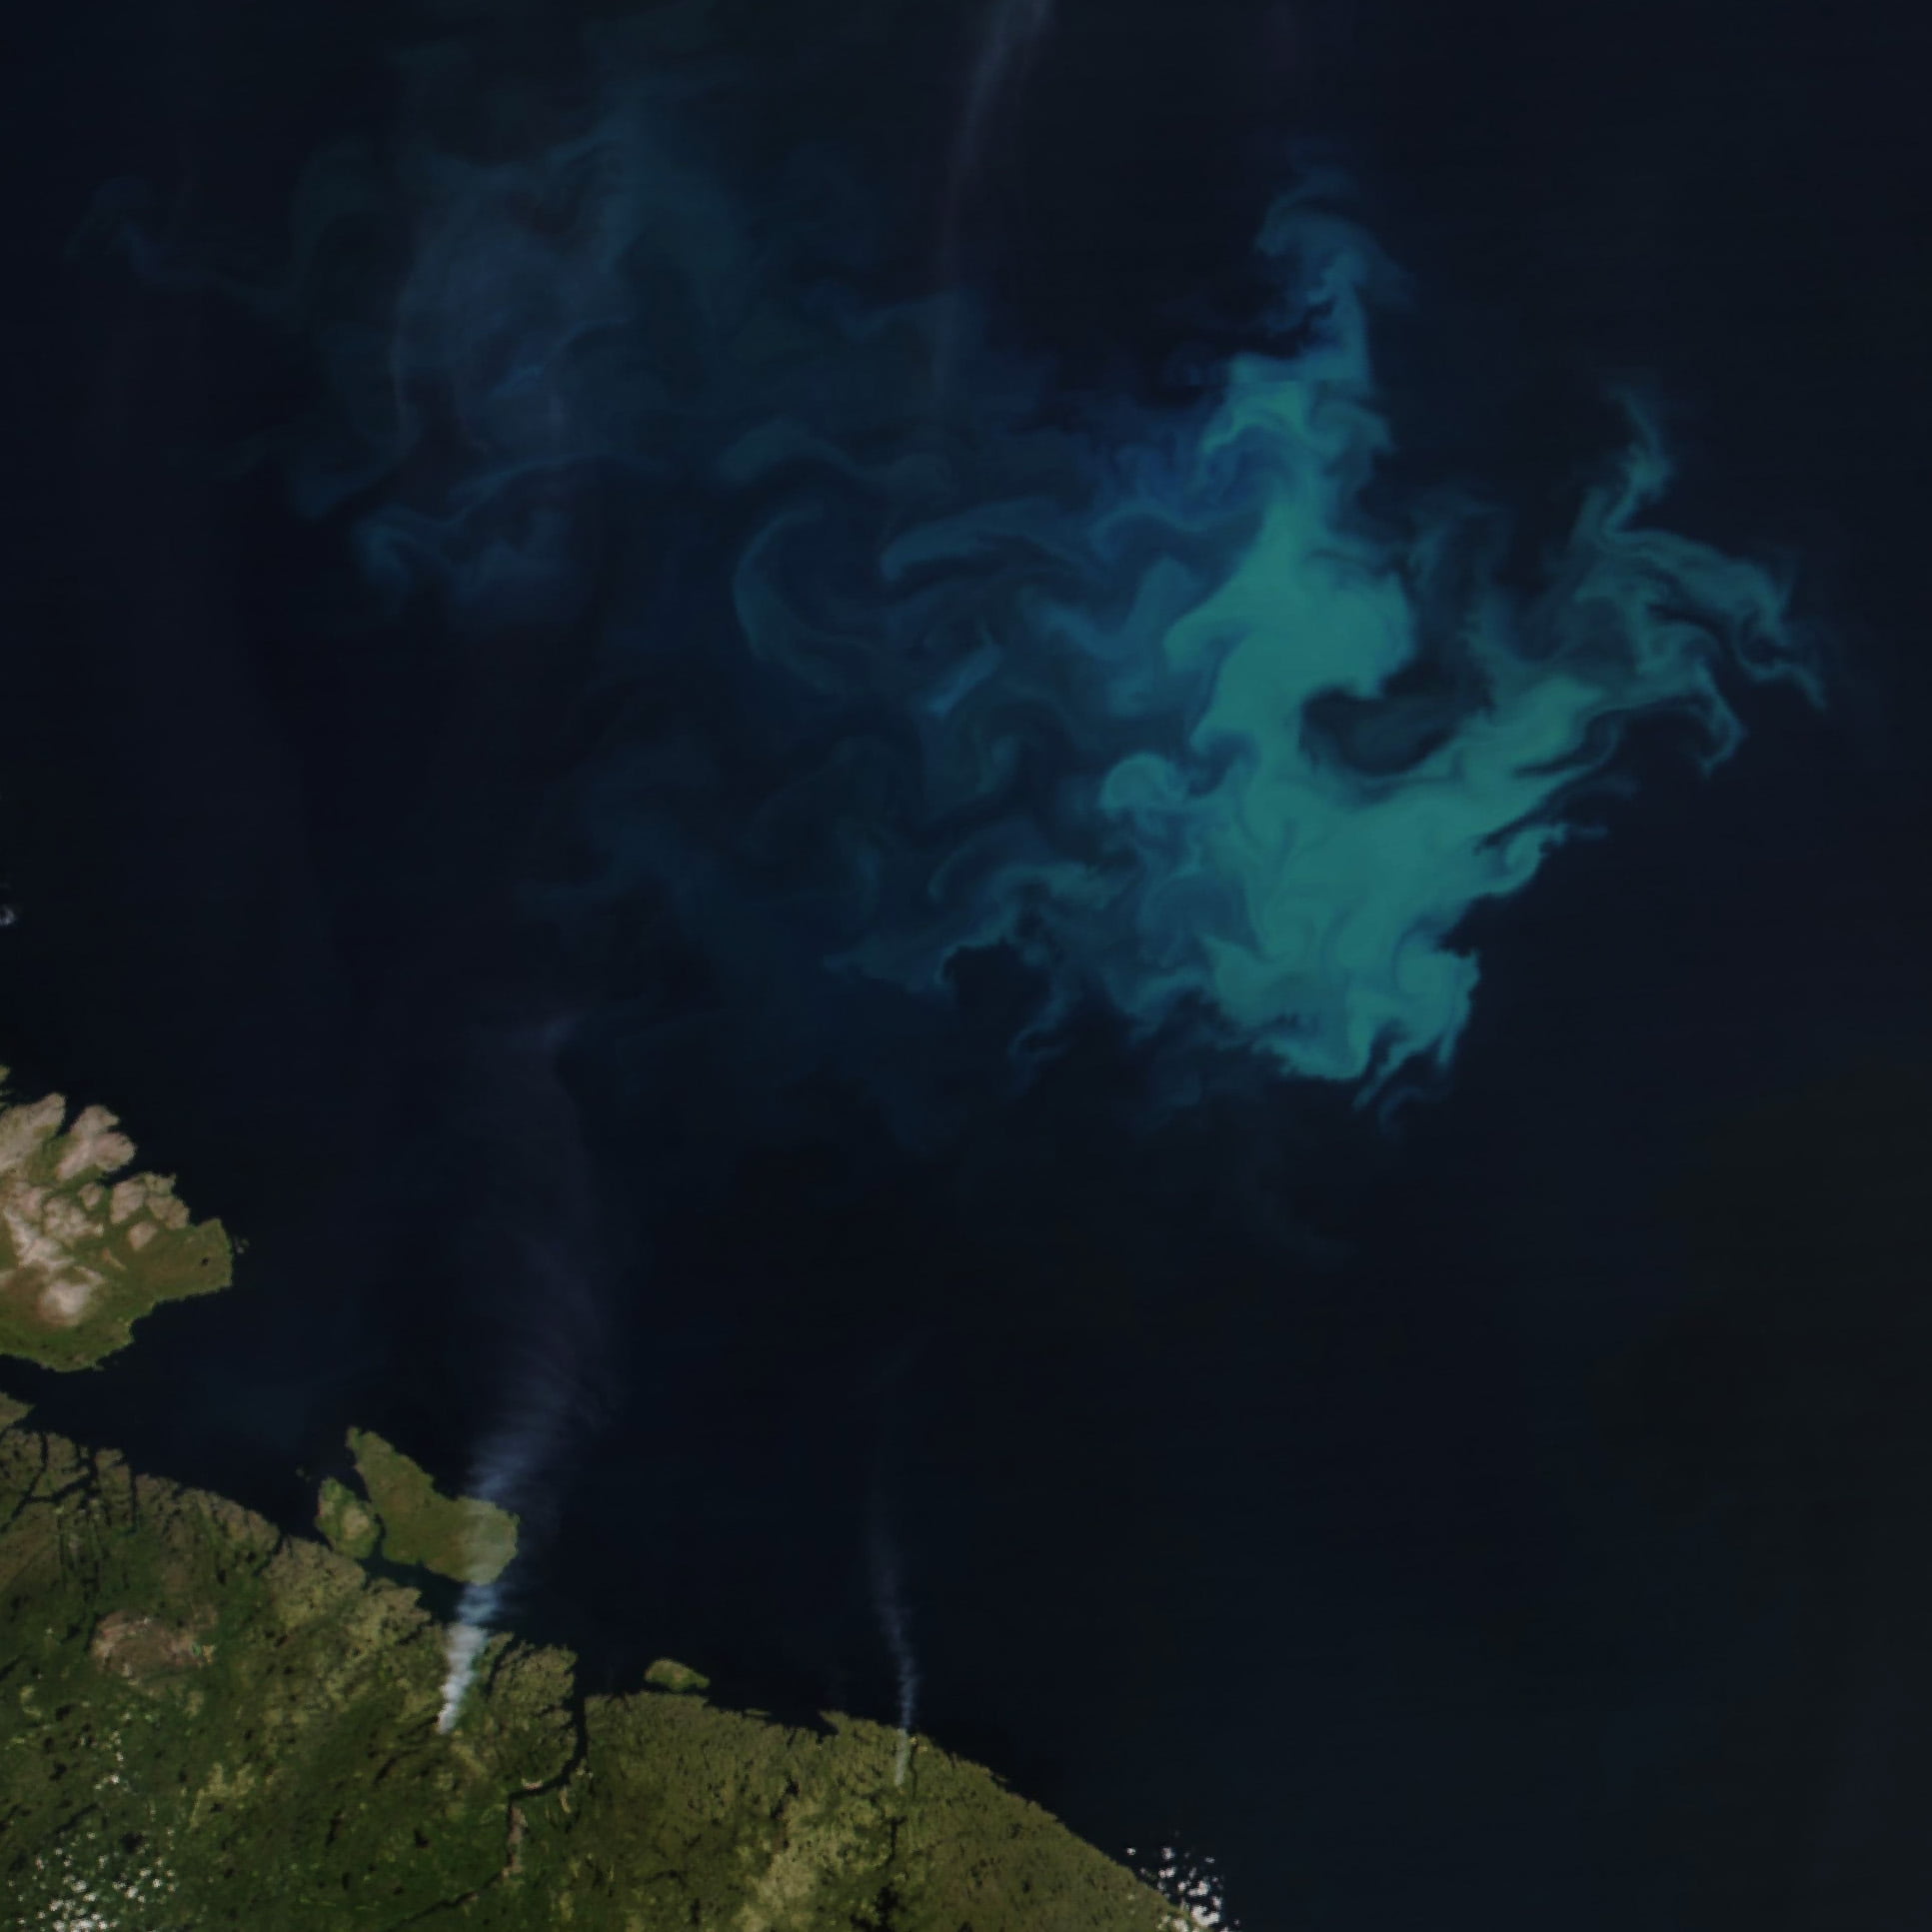
Blooming in Blue
Summers in the Barents Sea — a shallow region off the northern coasts of Norway and Russia — trigger phytoplankton blooms like the one in this satellite image. The blue shade of the bloom suggests the work of coccolithophores, a type of plankton armored in white calcium carbonate. This type of plankton thrives in the warm, stratified waters of the late summer. Earlier in the year, the water tends to be nutrient-rich and well-mixed, conditions which favor diatom plankton species instead. Their blooms appear greener in satellite images. (Image credit: W. Liang; via NASA Earth Observatory)
Fediverse Reactions
-


