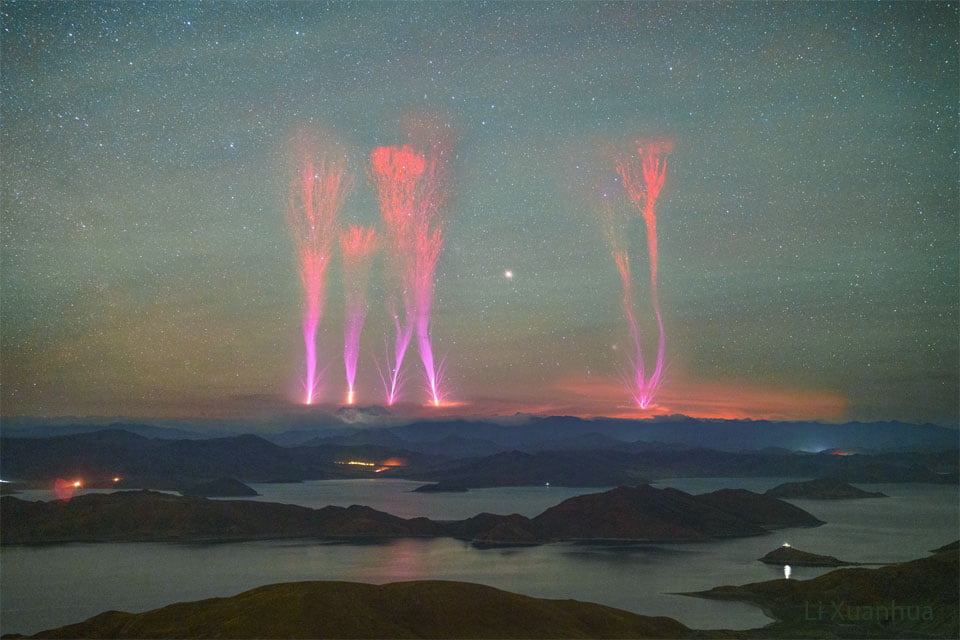
Stormy skies feature much more than the forked cloud-to-ground lightning we’re used to seeing. This composite image shows a rare and recently-recognized type of lightning known as a gigantic jets. This type of lightning travels from the top of thunderclouds, around 16 km in altitude, up to the ionosphere at about 90 km. Their bottoms look a bit like blue jets, while their upper reaches look like red sprites, two other types of unusual lightning. The mechanism behind gigantic jets is a topic of ongoing research, but your best chance at seeing them is watching a distant thunderstorm from a clear vantage. (Image credit: Li X.; via APOD)
Tag: meteorology

How a Storm Can Ruin Your Tea
Last November, a windstorm, known as Storm Ciarán in the U.K., blew through Europe with wind speeds as high as 130 kilometers per hour. All that wind came with a significant drop in atmospheric pressure. Researchers found that the pressure drop was large enough to lower the boiling point of water more than full 2 degrees Celsius. That difference probably wouldn’t register for anyone waiting for their kettle to boil, but it could decidedly affect the final cup of tea. Tea flavor is quite sensitive to the temperature of the boiling water used to brew it, as it affects how well the tannins get extracted. According to the researchers, Ciarán’s conditions potentially ruined millions of cups of breakfast tea in the greater London area. (Image credit: E. Akyurt; research credit: G. Harrison et al.; via Gizmodo)

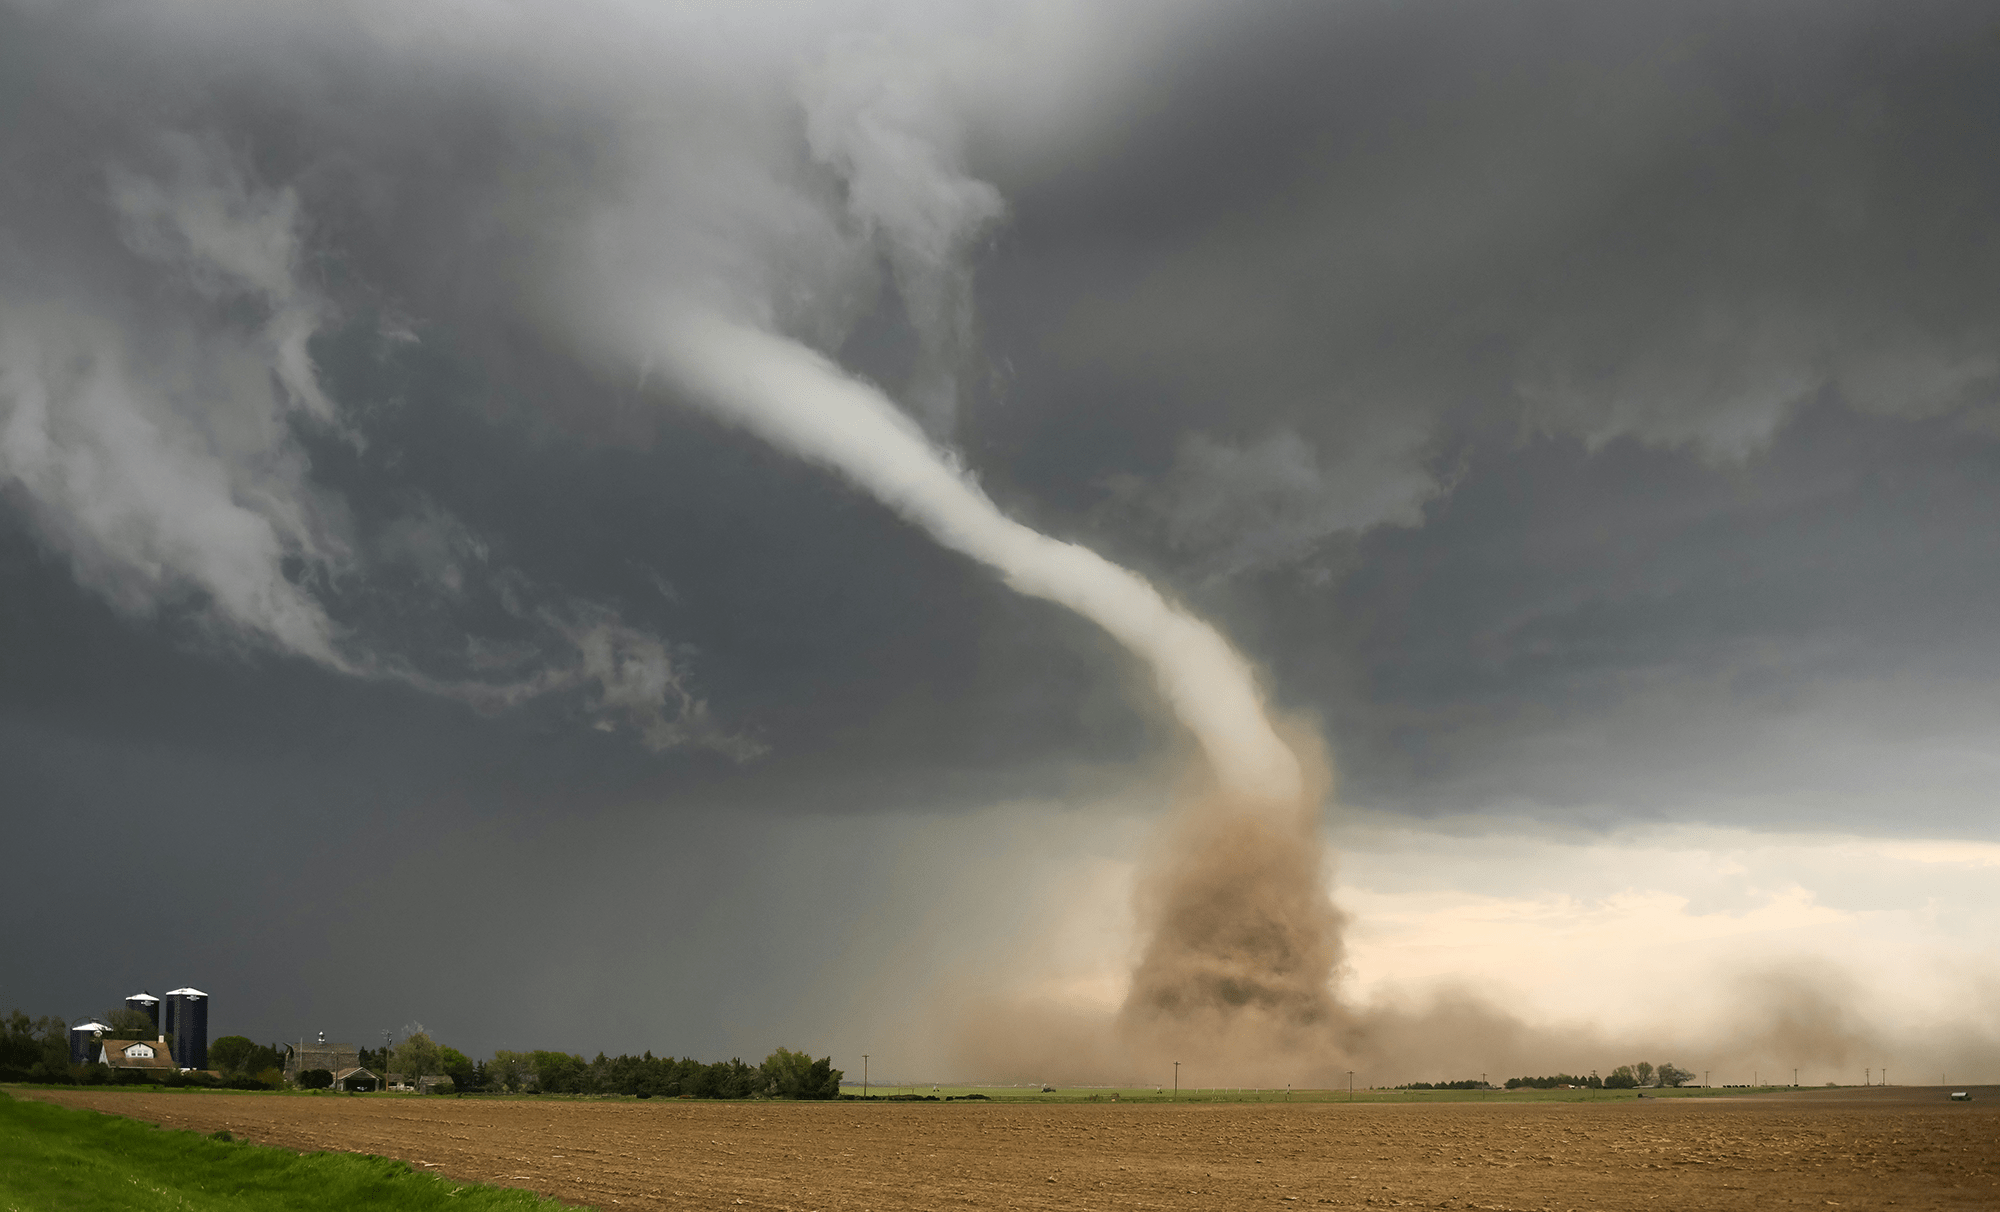
Why Tornado Alley is North American
Growing up in northwest Arkansas, I spent my share of summer nights sheltering from tornadoes. Central North America — colloquially known as Tornado Alley — is especially prone to violent thunderstorms and accompanying tornadoes. That’s due, in part, to two geographical features: the Rocky Mountains and the Gulf of Mexico. Trade winds hitting the eastern slope of the Rockies get turned northward, imparting a counterclockwise vorticity. At the same time, warm moist air carried from the Gulf feeds into the atmosphere, creating perfect conditions for powerful thunderstorms. By this logic, though, South America should see lots of tornadoes, too, courtesy of the Andes Mountains and the moist environs of the Amazon Basin. To understand why South America doesn’t have a Tornado Alley, researchers used global weather models to investigate alternate North and South Americas.
They found that smoothness is a key ingredient for the upstream, moisture-generating region. Compared to the Amazon, the Gulf of Mexico is incredibly flat. With a flat Gulf, tornadoes abounded in North America, but their numbers dropped once that area was roughened to mimic the Amazon. The opposite held true, too: a smoothed-out Amazon Basin resulted in more simulated South American tornadoes.
For those in Tornado Alley, the results don’t offer much hope for mitigating our summer storms — we can’t exactly roughen the ocean. But the study does sound a word for warning for South America; the smoother the Amazon region becomes — due to mass deforestation — the more likely tornadoes become in parts of South America. (Image credit: G. Johnson; research credit: F. Li et al.; via Physics World)

The Real Butterfly Effect
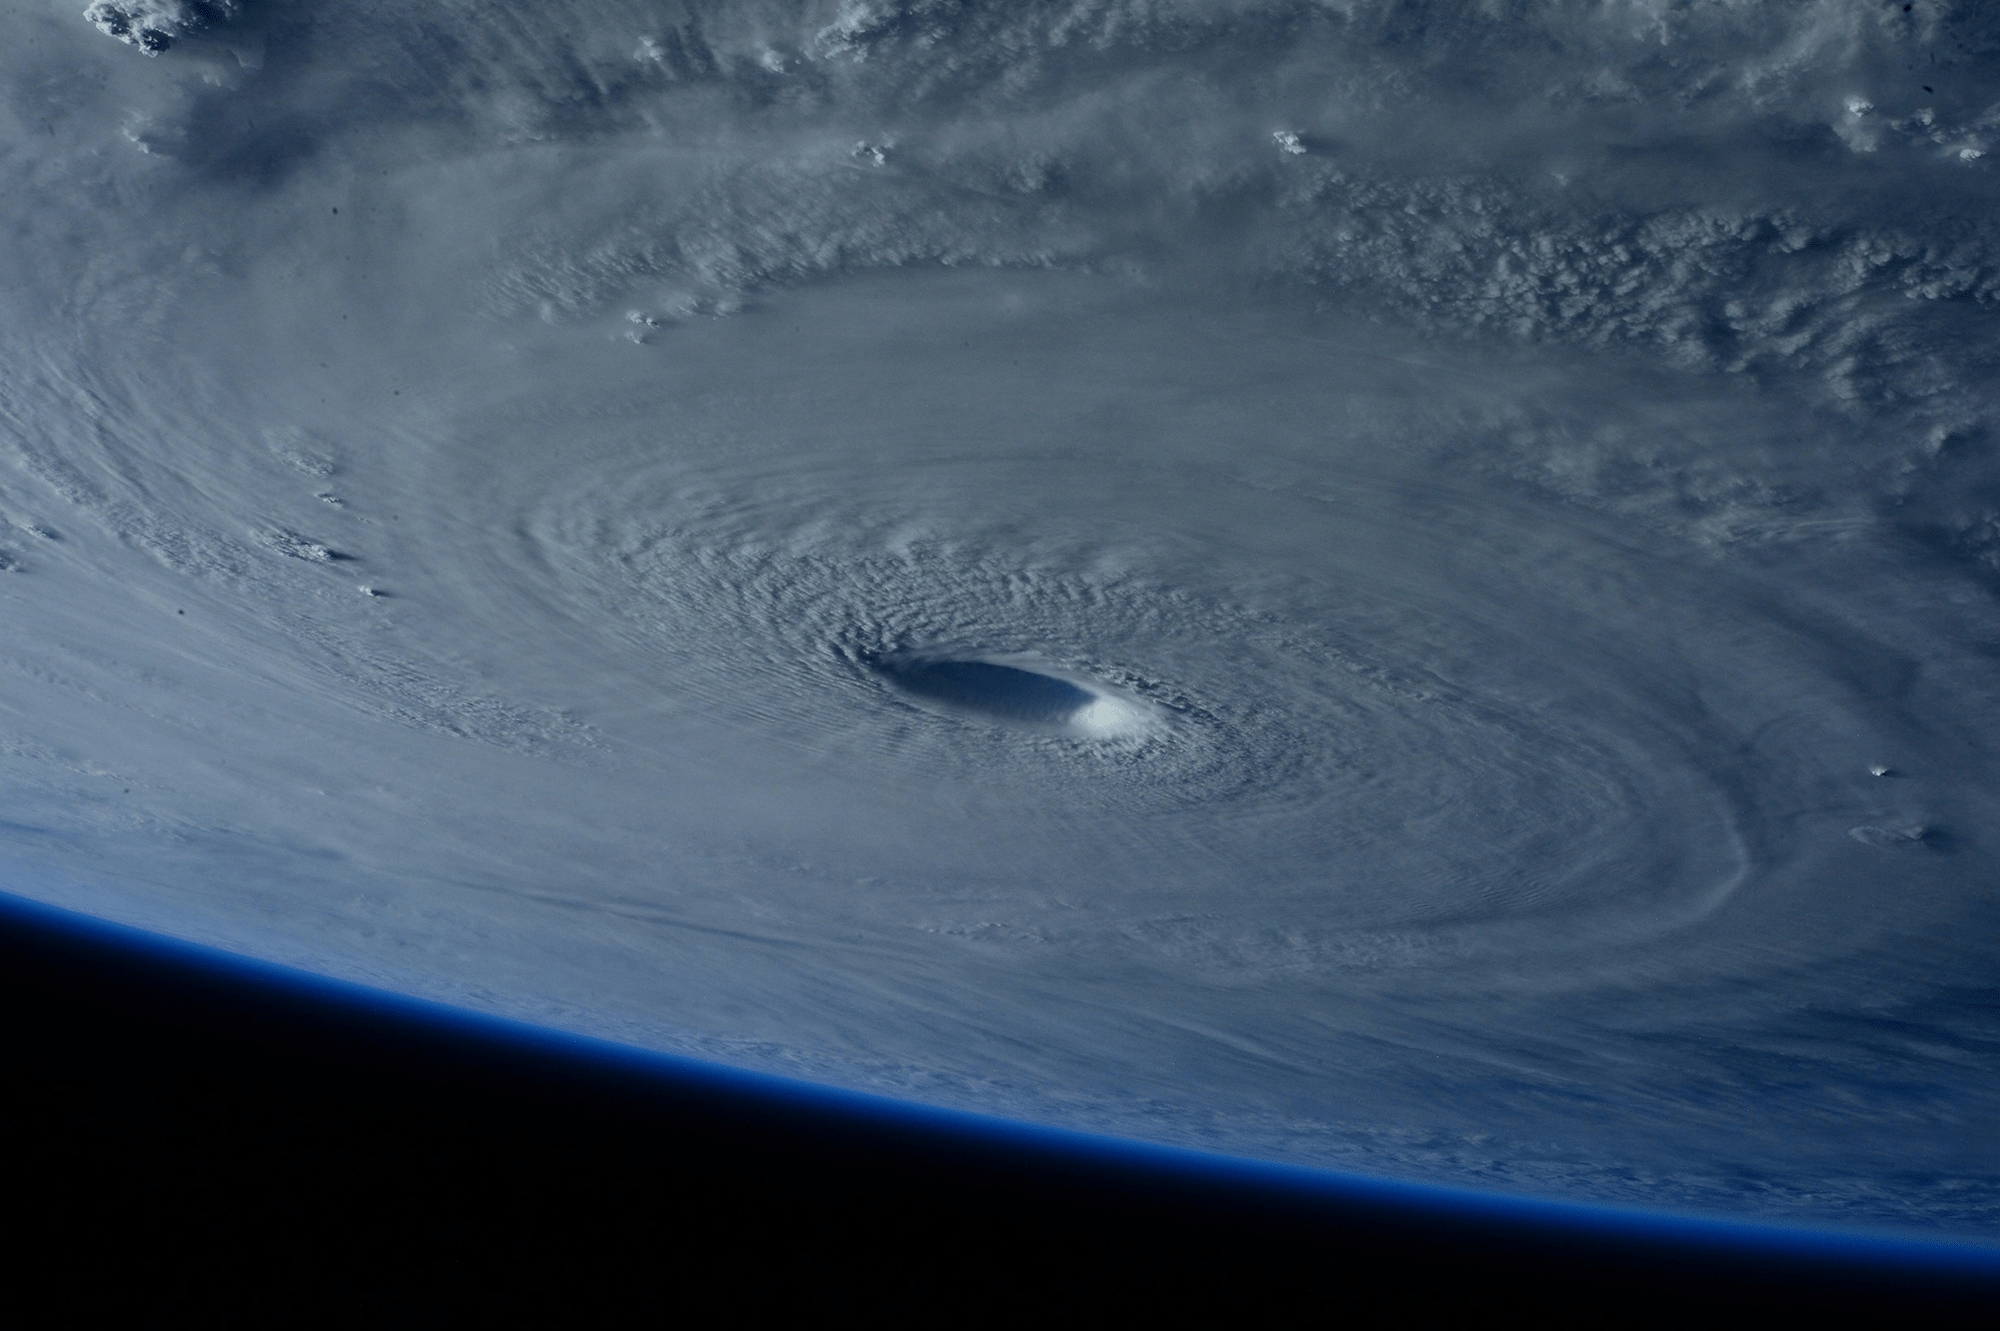
The butterfly effect — that the flapping of a butterfly’s wings in Brazil can cause a tornado in Texas — expresses the sensitivity of a chaotic system to initial conditions. In essence, because we can’t possibly track every butterfly in Brazil, we’ll never perfectly predict tornadoes in Texas, even if the equations behind our weather forecast are deterministic.
But this interpretation doesn’t fully capture the subtleties of the situation. With fluid dynamics, the small scales of a flow — like the turbulence in an individual cloud — are linked to the largest scales in the flow — for example, a hurricane. For short times, we’re actually quite good at predicting those large scales; our weather forecasts can distinguish sunny days and cloudy ones a week out. But at smaller scales, the forecast errors pile up quickly. No one can forecast that an individual cloud will form over your house three days from now. And because the small scales are linked to the larger scales, the uncertainties from the small scale cascade upward, limiting how far into the future we can reliably predict the weather.
And, unfortunately, drilling down to capture smaller and smaller scales in our models can’t fix the problem, unless our initial uncertainties are identically zero. To get around this problem, weather forecasters instead use ensemble forecasting, where they run many simulations of the weather with slightly different initial conditions. Those differences in initial conditions let the forecasters play with those initial uncertainties — how accurate is the temperature reading from that station? How reliable is the instrument reporting that humidity? How old is the satellite data coming in? Once all the forecasts are run, they can see how many predicted sunny days versus rainy ones, which ones resulted in severe weather, and so on. Often the probabilities we see in our weather app — like 30% chance of rain — depend on factors including how many of the forecasts resulted in rain.
Unfortunately, this butterfly effect permanently limits just how far into the future we can predict weather — at least until we fully understand the nature of the Navier-Stokes equations. For much more on this interesting aspect of chaos, check out this Physics Today article. (Image credit: NASA; see also T. Palmer at Physics Today)
Fediverse Reactions
-

Light Pillars
These lovely pillars of light over the Mongolian grasslands are the result of tiny, suspended ice crystals. With the right weather conditions, ice crystals can align so that their largest faces are roughly parallel to the ground. In this orientation, the crystals collect and reflect artificial lights from the ground into these towering light pillars. It’s worth noting that the pillars aren’t located directly above the light source; instead, the column of crystals will lie roughly halfway between the light source and the observer. Next time you’re out on a cold winter night, see if you can find one! (Image credit: N. D. Liao; via APOD)

Extreme Weather and Climate Change
Extreme weather events like floods, hurricanes, atmospheric rivers, heat waves, and droughts are increasingly discussed in terms of the effects of climate change. Because complex systems have complex causes, it’s difficult to draw exact lines of causality between human-made climate change and a given weather event. But scientists have built an array of tools that help address two key questions: 1) how much more extreme was this weather due to climate change, and 2) how much more likely was this extreme event due to climate change?

Comparing (a) the actual flooding from Hurricane Harvey with (b) the estimated flood that would have occurred without climate change. The depth of actual flood waters was about 1m greater due to climate change. To answer the first question, scientists often use hindcasts. In these studies, scientists first build a simulation that mirrors the actual event, like Hurricane Harvey’s stall over Houston, Texas. Once their simulated storm reflects the actual one, they tweak the initial conditions to reflect a world without climate change and see how the storm differs. By comparing the actual and simulated floods (image above), scientists can estimate just how much worse climate change made things. In Harvey’s case, they found that human activity increased the overall precipitation by 19% and that 32% of the flooded homes in Harris county would not have flooded in a world without climate change. Detailed results from that particular study can be explored in the web portal here. (Image credits: Flooded street – J. Gade, Harvey flooding – M. Wehner; research credit: M. Wehner in Physics Today)

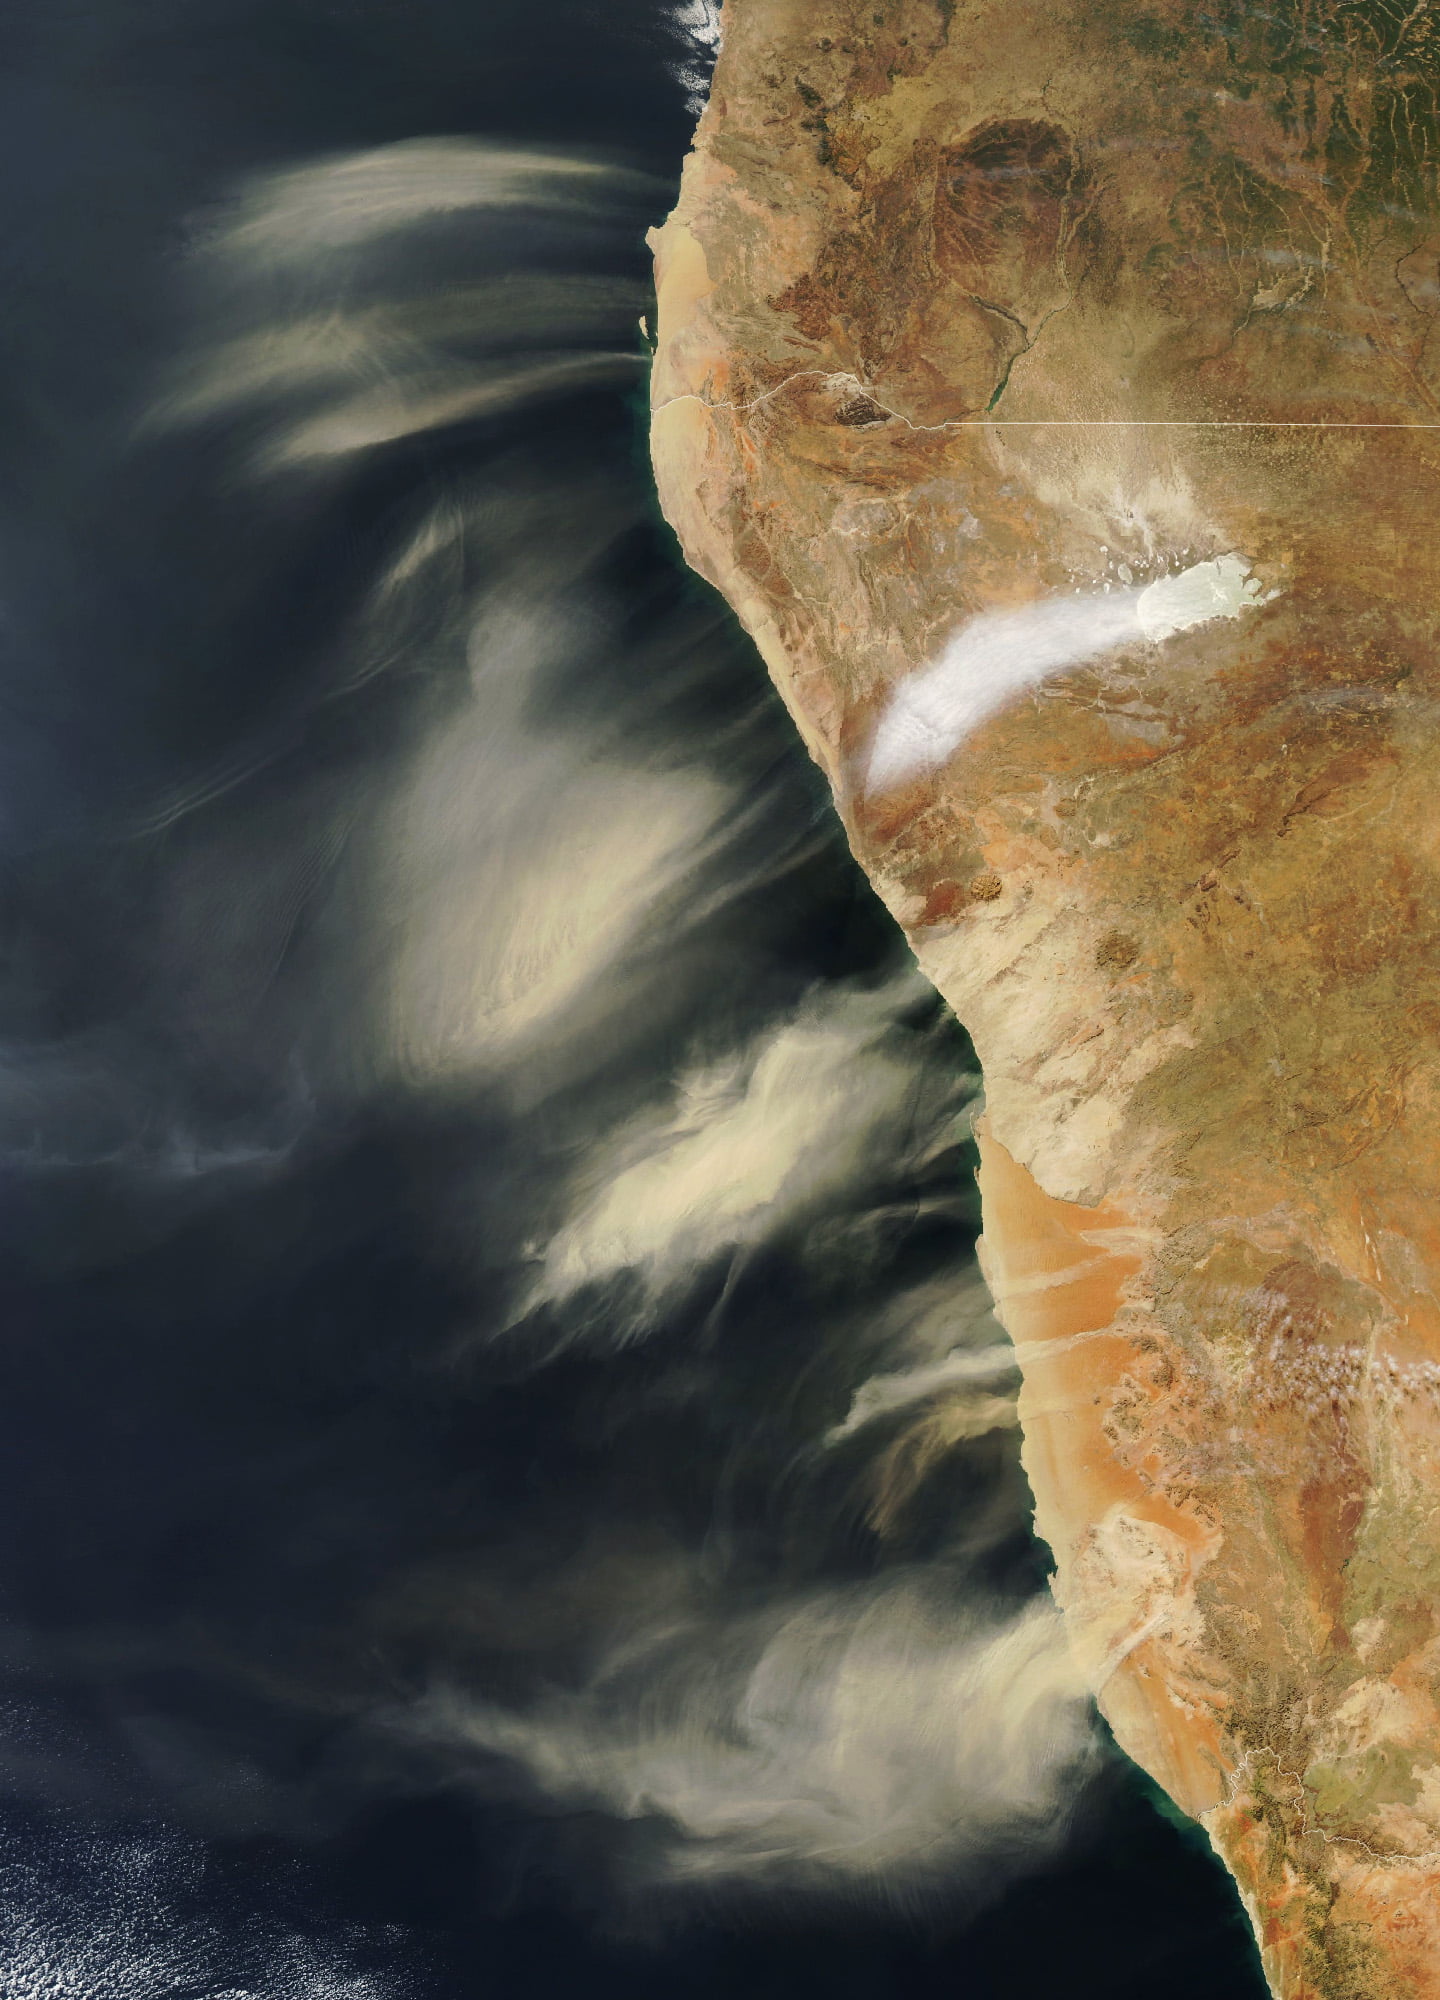
Dust Storms
Hot, dry berg winds swept down from the Namibian highlands and sent these plumes of dust flying out to the Atlantic coast. Another plume — white instead of brown — marks salt dust from the Etosha Pan salt flat. The dust and salt become aerosol particles in the atmosphere — seeds for raindrops to form. Coastal towns sometimes need construction equipment to deal with the drifting sand from these storms, but these storms are small compared to Saharan dust storms. Those storms are so large that their dust influences the weather on the other side of the Atlantic. (Image credit: W. Liang; via NASA Earth Observatory)
Rolling Over Wisconsin
Although they may look sinister, roll clouds like this one are no tornado. These unusual clouds form near advancing cold fronts when downdrafts cause warm, moist air to rise, cool below the dew point, and condense into a cloud. Air in the cloud can circulate around its long horizontal axis, but the clouds won’t transform into a tornado. Roll clouds are also known as Morning Glory clouds because they often form early in the day along the Queensland coast, where springtime breezes off the water promote their growth. The clouds do form elsewhere, though; this example is from Wisconsin in 2007. (Image credit: M. Hanrahan; via APOD)
Clouds Down Under
This large and unusual cloud formation was captured one July morning over western Australia. Stretching over 1,000 kilometers, the clouds have interesting features at both the large and small scale. The small-scale ripples within the clouds are gravity waves triggered by the terrain below. The larger, arced features are tougher to explain, though they may also be related to gravity waves and terrain, just on a much larger scale. They also resemble fallstreak clouds where supercooled droplets evaporate from the inside of the cloud out. (Image credit: W. Liang; via NASA Earth Observatory)

“Vorticity 5”


Photographer and stormchaser extraordinaire Mike Olbinski is back with the fifth volume in his “Vorticity” series. Shot over the 2022 and 2023 tornado seasons in the U.S. Central Plains, this edition has virtually everything: supercells, microbursts, lightning, tornadoes, and haboobs. There’s towering convection and churning, swirling turbulence. It’s a spectacular look at the power and grandeur of our atmosphere. (Video and image credit: M. Olbinski)