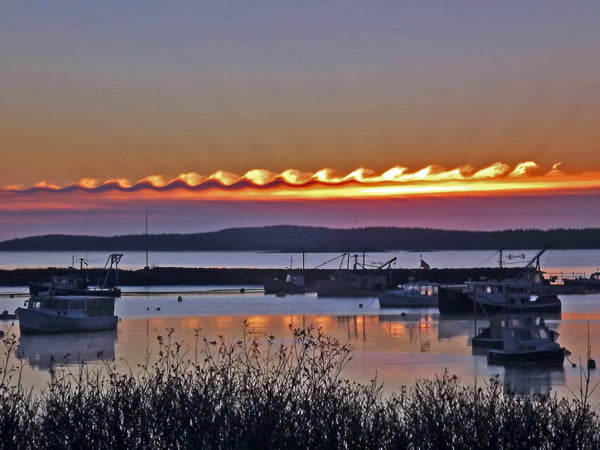
Tag: Kelvin-Helmholtz instability

  • Featured Video Play Icon

    The Kelvin-Helmholtz Instability

    The Kelvin-Helmholtz instability is a pattern frequently found in nature. It has a distinctive shape, like a series of breaking ocean waves that curl over on themselves to create a string of vortices. The instability shows up when there is a velocity difference between two fluid layers. The unequal shear between the two layers magnifies any disturbance to their interface, which manifests in the fractal, overturning whorls seen in the numerical simulation above. You can find the Kelvin-Helmholtz instability in the lab, in the sky, in the oceanon Jupiter and Mars–even on the sun! For more information on the methods used to create the simulation above, check out the full paper. (Video and research credit: K. Schaal et al.)

  • Phytoplankton Flow Viz

    Phytoplankton Flow Viz

    Nutrient-rich waters off Patagonia in South America blossom with phytoplankton in this satellite image. When present in large quantities, these microscopic photosynthesizers lend a green hue to the water. They act as seed particles in the flow, highlighting the currents and flow that carry them. If you check out the full resolution version of the photo, you can admire the rich detail in the whorls of ocean mixing. There even seem to be Kelvin-Helmholtz-like instabilities creating trains of vortices along the interface between separate bands. (Photo credit: NASA/ASU; via SpaceRef; submitted by jshoer)

  • Kelvin-Helmholtz Clouds

    Kelvin-Helmholtz Clouds

    When differing layers of fluid move past one another, friction between them causes shear. This shear quickly transforms a simple flat interface between fluid layers into a wavy unstable boundary that resembles a series of breaking ocean waves. This effect is known as the Kelvin-Helmholtz (KH) instability. In the atmosphere, this instability causes air layers with differing temperatures and moisture content to form wave-like clouds where the two layers meet. Other examples of the effect are widespread. On earth, many ocean waves are generated by wind shearing the water; elsewhere in our solar system, the cloud bands of Jupiter are lined with spinning eddies from the KH instability. (Photo credit: H. Bondo)

  • Measuring Wind Speed by Satellite

    Measuring Wind Speed by Satellite

    Weather modeling and forecasting in recent decades have benefited enormously from the availability of more data. For example, satellites now measure wind speeds over the open ocean, instead of data simply coming from isolated ships and buoys.  The satellites do this by measuring the roughness of the ocean using radar or GPS signals bounced off the ocean surface. From this researchers can construct a map of wave height and direction like the one in the animation above. For a large body of water, waves are primarily generated by wind shearing the water at the interface. The waves we see are a result of the Kelvin-Helmholtz instability between the wind and ocean. Because this is a well-known behavior, it is possible to connect the waves we observe with the wind conditions that must have generated them. (Image credit: ESA; animation credit: Wired; submitted by jshoer)

  • Featured Video Play Icon

    Jupiter Timelapse

    This timelapse video shows Jupiter as seen by Voyager 1. In it, each second corresponds to approximately 1 Jupiter day, or 10 Earth hours. Be sure to fullscreen it so that you can appreciate the details. The timelapse highlights the differences in velocity (and even flow direction!) between Jupiter’s cloud bands. It is these velocity differences that create the shear forces which cause Kelvin-Helmholtz instabilities–the series of overturning eddies–seen between the bands. Earth also has bands of winds moving in opposite directions, but there are fewer of them and the composition of our atmosphere is such that they do not make for such a dramatic naked eye view of large-scale fluid dynamics. (Video credit: NASA/JPL/B. Jónsson/I. Regan)

  • Featured Video Play Icon

    Kelvin-Helmholtz in the Lab

    The Kelvin-Helmholtz instability looks like a series of overturning ocean waves and occurs between layers of fluids undergoing shear. This video has a great lab demo of the phenomenon, including the set-up prior to execution. When the tank is tilted, the denser dyed salt water flows left while the fresh water flows to the right. These opposing flow directions shear the interface between the two fluids, which, once a certain velocity is surpassed, generates an instability in the interface. Initially, this disturbance is much too small to be seen, but it grows at an exponential rate. This is why nothing appears to happen for many seconds after the tilt before the interface suddenly deforms, overturns, and mixes. In actuality, the unstable perturbation is present almost immediately after the tilt, but it takes time for the tiny disturbance to grow. The Kelvin-Helmholtz instability is often seen in clouds, both on Earth and on other planets, and it is also responsible for the shape of ocean waves. (Video credit: M. Hallworth and G. Worster)

  • Featured Video Play Icon

    The Kelvin-Helmholtz Instability in the Lab

    Though often spotted in water waves or clouds, the Kelvin-Helmholtz instability is easily demonstrated in the lab as well. Here a tank with two layers of liquid – fresh water on top and denser blue-dyed saltwater on the bottom – is used to generate the instability. When level, the two layers are stationary and stable due to their stratification. Upon tilting, the denser blue liquid sinks to the lower end of the tank while the freshwater shifts upward. When the relative velocity of these two fluids reaches a critical point, their interface becomes unstable, forming the distinctive wave crests that tumble over to mix the two layers. (Video credit: M. Stuart)

  • Ocean Waves in the Sky

    Ocean Waves in the Sky

    These wave-like Kelvin-Helmholtz clouds can form due to shear between different layers of air in the atmosphere. When one region of air has a higher velocity than the other, their interface forms a shear layer, which can break down in this wavy pattern. In this case, the lower layer of air was moist enough to form condensation and clouds, making the pattern visible to the naked eye. (Photo credit: Gene Hart; via Flow Visualization)

  • The Beauty of the Great Red Spot

    The Beauty of the Great Red Spot

    Jupiter is home to one of the most famous storms in the solar system, the Great Red Spot, which Earth observations place at a minimum of 180 (Earth) years in duration.  Some evidence suggests that it may have been observed by humans as early as 1665. The magnitude of such a storm is almost unimaginable. At its narrowest point, the storm is still as wide as our entire planet and observations from the Voyager crafts indicate that the storm has 250 mph winds. The scale of mixing and turbulence around the storm, seen in photographs, is stunning and beautiful. (Photo credits: NASA/Voyager 1 and Michael Benson; submitted by oneheadtoanother)

  • Featured Video Play Icon

    Viscoelastic Jets

    Unlike Newtonian fluids, such as air and water, viscoelastic fluids exhibit non-uniform reactions to deformation. In this video, researchers explore the effects of this behavior when a liquid jet falls into another fluid. When fluids move past one another at different speeds in this manner, there is a shearing force which often leads to the wave-like Kelvin-Helmholtz instability between the fluids. Here we see for a variety of wavelengths how the breakdown of a Newtonian and viscoelastic jet differ. The Newtonian jets form clean lines and complicated tulip-like shapes, but the viscoelasticity of the non-Newtonian jets inhibits the growth of these instabilities, surrounding the central jet with wisps of escaping fluid. For more, see Keshavarz and McKinley. (Video credit: B. Keshavarz and G. McKinley)