


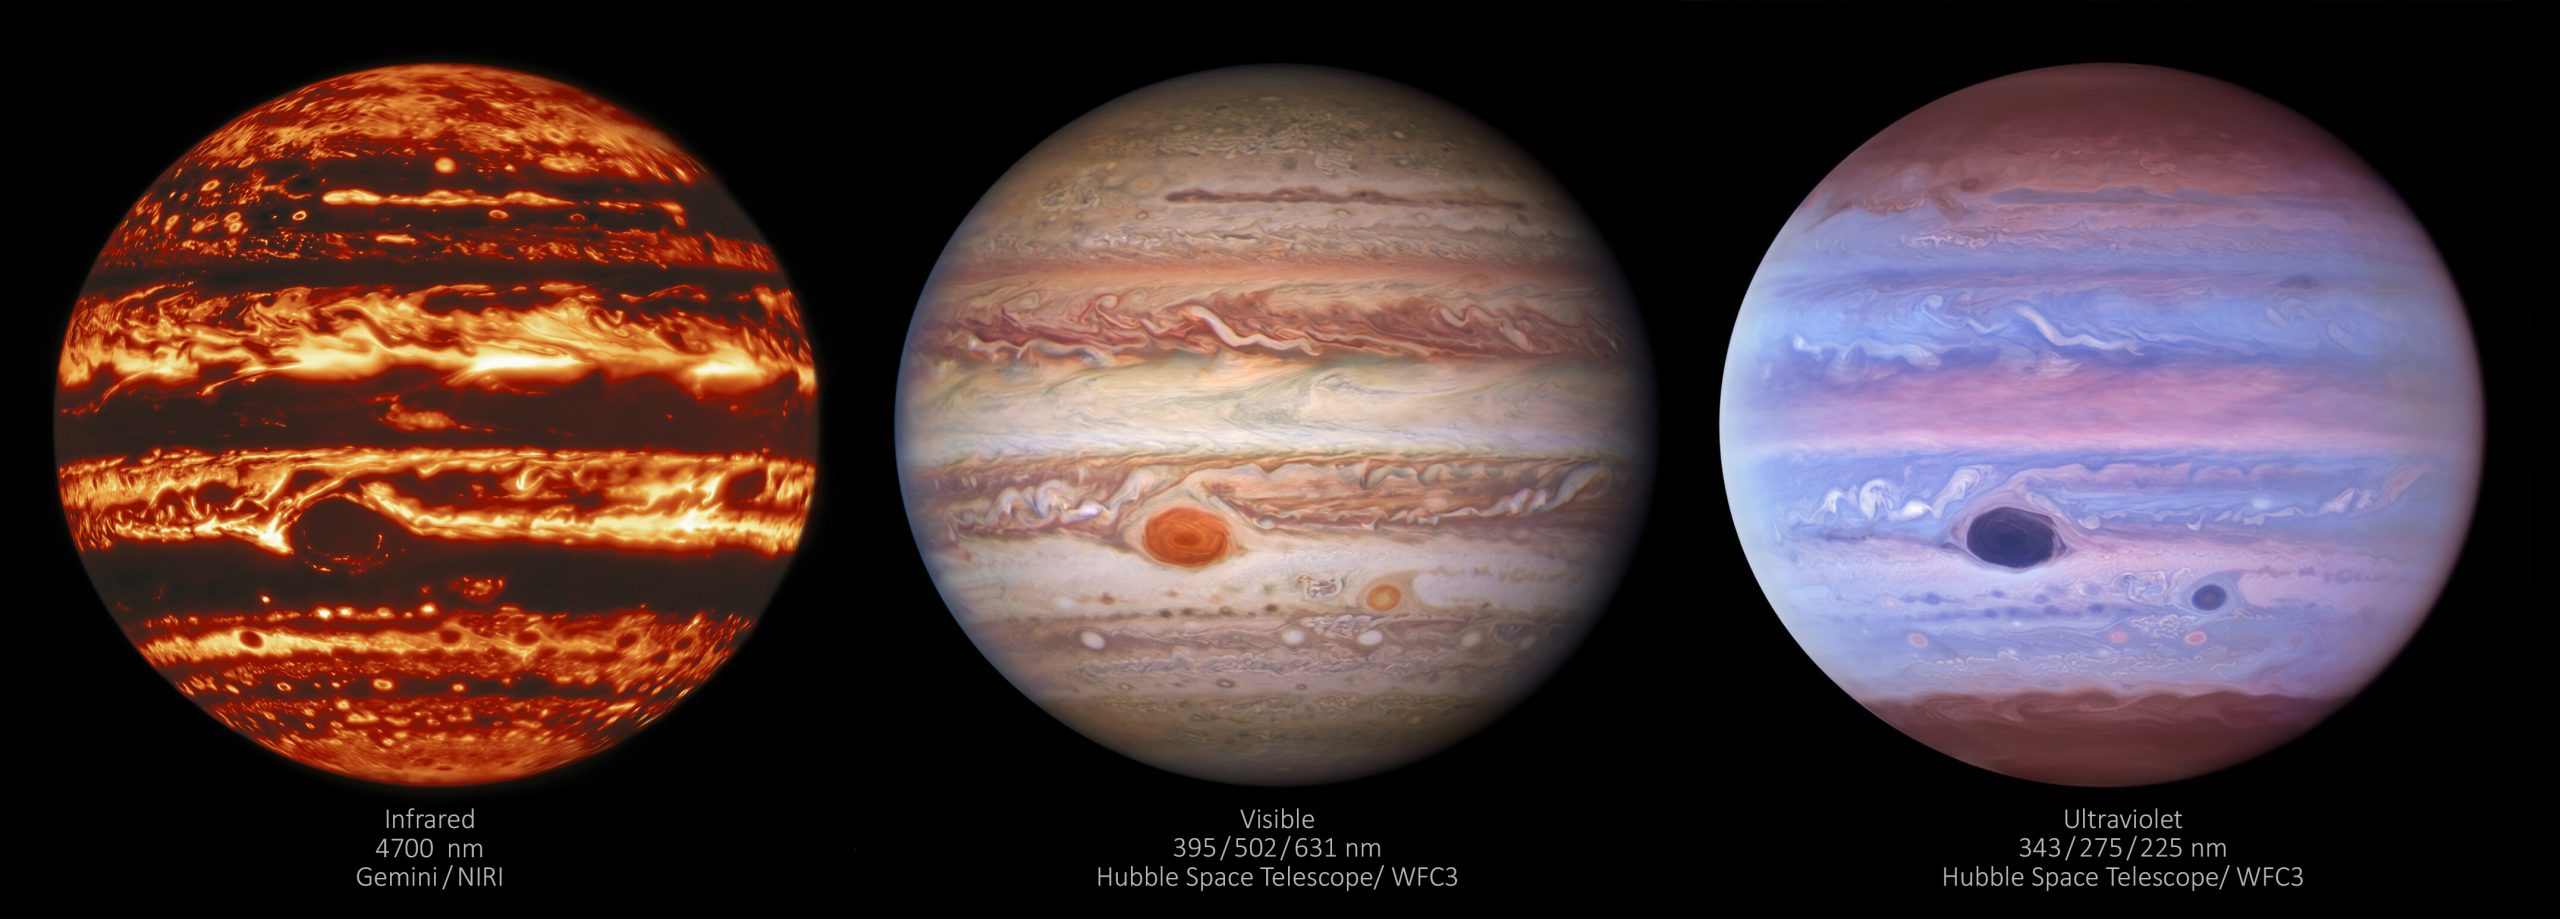


Sometimes the key to unraveling a mystery is to observe the phenomenon in different ways. That’s why researchers are increasingly taking advantage of multiple instruments simultaneously observing targets like Jupiter. Here we see the gas giant in three different types of light: infrared, visible, and ultraviolet. Infrared bands reveal the hot and cold regions of Jupiter’s clouds, allowing scientists to identify convective areas. Ultraviolet observations can reveal high-energy processes, like Jupiter’s auroras. And the colors revealed in visible light can give hints about chemical make-up in different regions. But to get a fuller picture, scientists compare all three modes — along with radio signal data from Juno — to understand topics like the planet’s lightning-filled storms. (Image credits: International Gemini Observatory/NOIRLab/NSF/AURA/NASA/ESA, M.H. Wong and I. de Pater (UC Berkeley) et al.; via Gizmodo)


")
")
")
")
 and schlieren photograph (right) of a droplet impact (from A. Wilkens et al.)") gorbax
gorbax