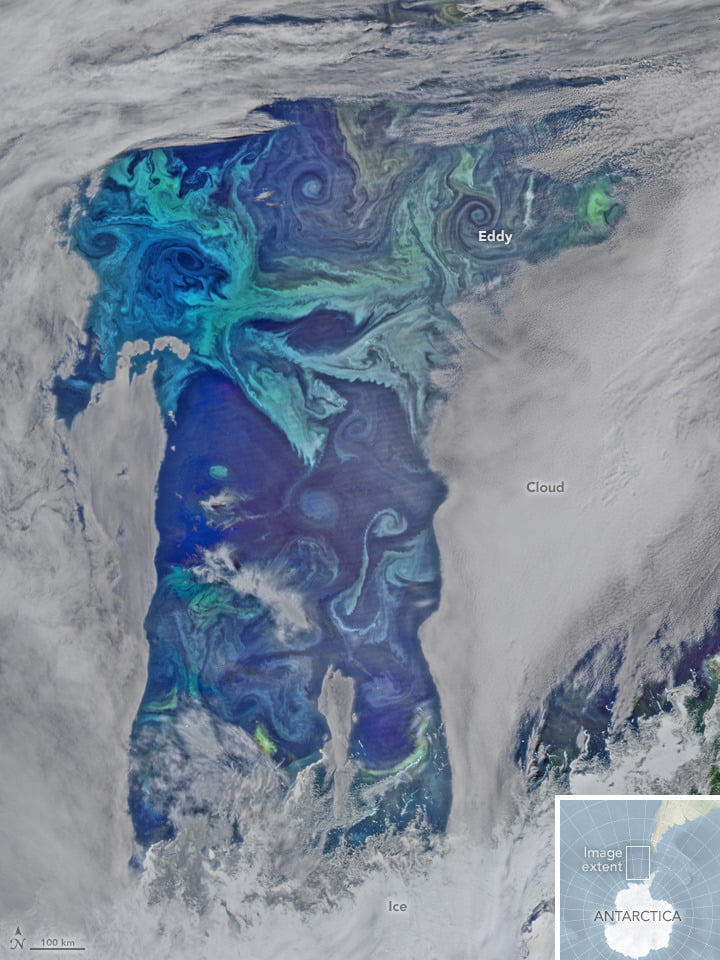
Phytoplankton, tiny plant-like organisms that live in ocean waters, act like nature’s tracer particles, making visible flows that would otherwise go unnoticed. In this satellite imagery, a phytoplankton bloom in the Southern Ocean off the coast of Antarctica highlights the turbulence of this region. Strong, steady winds and currents are typical for this area, which helps drive heat exchange between the ocean and atmosphere. The swirling eddies we see – many of them 100 km across! – are evidence of that turbulence. They’re also a sign of nitrogen and other nutrients getting mixed up in the action; it’s these nutrients that help generate the bloom in the first place. (Image credit: N. Kuring/NASA Earth Observatory)
Tag: flow visualization

Underwater Landslides
Turbidity currents are a gravity-driven, sediment-laden flow, like a landslide or avalanche that occurs underwater. They are extremely turbulent flows with a well-defined leading edge, called a head. Turbidity currents are often triggered by earthquakes, which shake loose sediments previously deposited in underwater mountains and canyons. Once suspended, these sediments make the fluid denser than surrounding water, causing the turbidity current to flow downhill until its energy is expended and its sediment settles to form a turbidite deposit. By sampling cores from the seafloor, scientists studying turbidites can determine when and where magnitude 8+ earthquakes have occurred over the past 12,000+ years! (Video credit: A. Teijen et al.; submitted by Simon H.)
Do you enjoy FYFD and want to help support it? Then please consider becoming a patron!
Fluids Round-Up
New year, new (or renewed) experiments. This is the fluids round-up, where I collect cool fluids-related links, articles, etc. that deserve a look. Without further ado:
- Above is a new music video from the Julia Set Collection, featuring all non-CGI, fluids-based visuals. I spy soap films, vibrating liquids, and lots of cool effects with reflection and refraction. We featured some of their previous work, too.
- The Atlantic has a great piece about jellyfish and how they might just change our understanding of efficient swimming.
- Check out the wild shape-shifting of these drops of oil during freezing and learn about the plastic crystal phase some matter experiences.
- Nature has an interesting article on active matter, an intersection of physics and biology exploring how matter self-organizes, whether at the level of cells or the flocking of birds. (submitted by 1307phaezr)
- Ever wonder what the human face looks like in 457 mph winds? Wonder no more.
- Gizmodo has a beautiful set of macro photos of snowflakes. Interested in how snowflakes form and why there are so many different shapes? We’ve got you covered.
- Wired takes a look at the surf forecaster who predicts the waves for the Mavericks big-wave competition.
- Robert Krulwich (and friends) took a closer look at our fish in microgravity. Here’s what they learned!
(Video credit and submission: Julia Set Collection/S. Bocci; image credit: IRPI LLC, source)

Helicopter Tip Vortices
Airplanes and other fixed-wing aircraft produce wingtip vortices as a result of their finite length. Rotor blades, like those on helicopters, produce the effect as well. Both wings and rotors generate lift by trapping low-pressure air on their top surface and high-pressure air below. At their tips, though, the high-pressure air can sneak around the wing or rotor, creating vortices like the ones visualized above. Here smoke from a wire is entrained by the rotors’ inflow and twisted into a tip vortex. The line of vortices drifts downward due to the rotor’s downwash. (Image credit: M. Giuni et al., source)

Inside a Popping Bubble
Popping a soap bubble is more complicated than what the eye can see. In high-speed video, we find that the action is very directional, with the soap bubble film pulling away from the point of rupture. As it does so, waves, like those in a flapping flag, appear along the surface and strings of fluid form along the edge of the film before breaking into droplets. This video takes matters a step further, looking at what happens to air inside a bubble when it pops. Those subtle waves and strings of fluid we see in the high-speed rupture have a distinctive effect on air inside the bubble. As the film pulls away, it leaves behind a rippled, wavy surface rather than a smooth sphere of foggy air. (Video credit: Z. Pan et al.)
Hiding in the Sand


Flounders, stingrays, and other flat, bottom-dwelling fish often hide under sand for protection. These fish move by oscillating their fins or the edge of their bodies. They use a similar mechanism to bury themselves–quickly flapping to resuspend a cloud of particles, then hitting the ground so that the sand settles down to cover them. Researchers have been investigating this process by oscillating rigid and flexible plates and observing the resulting flow. When the flapping motion exceeds a critical velocity, the vortex that forms at the plate’s edge is strong enough to pick up sand particles. Understanding and controlling how and when these vortex motions kick up particles is useful beyond the ocean floor, too. Helicopters are often unable to land safely in sandy environments because of the particles their rotors lift up, and this work could help mitigate that problem. (Image credits: TylersAquariums, source; Richmondreefer, source; A. Sauret, source; research credit: A. Sauret et al.)
The Fluidic Oscillator


A fluidic oscillator is a device with no moving parts that sprays a fluid from side to side. The animations above illustrate how they work. A nozzle funnels a fluid jet through a chamber with two feedback channels. When the jet sweeps close to one side of the chamber, part of the fluid is directed along the feedback channel and back toward the inlet. That flow feeds into a recirculating separation bubble in the middle of the chamber. As that bubble grows, it pushes the jet back toward the other feedback channel, continuing the cycle. Many automobiles use fluidic oscillators in their windshield washer sprays. Check out the award-winning full video from the Gallery of Fluid Motion. (Image credit: M. Sieber et al., source)

Ignition
Shown here are the first instants after a bubble full of methane gas is ignited via laser. Using the schlieren optical method and a high-speed camera, scientists recorded the deflagration at 10,000 frames per second. Because schlieren imaging is very sensitive to small changes in density, we see not only the expanding flame front as the methane ignites but also the subtle waviness of the methane expanding into the surrounding air as the bubble bursts. (For comparison, check out what bursting a water balloon looks like at high-speed.) Be sure to head over to ScienceTake for the full schlieren video, and also check out this award-winning video of a match lighting made by the same researcher. (Image credit: V. Miller et. al.; full video: The New York Times; submitted by Rebecca M.)
ETA: An earlier version of this post mistakenly said the demo used a balloon full of methane rather than a bubble. Thanks to jump-first-think-later for the correction.
Visualizing Vortices
Flow visualization can be a valuable tool for understanding fluid dynamics. In this video, we see how it can help elucidate the mechanisms of flapping flight. By dyeing vortices from the leading edge in red rhodamine and vortices from the trailing edge in green fluorescein, it’s possible to distinguish their competing effects for wings of different size. The speed and efficiency of a flapping wing depends on the vortices it sheds–these provide its lift and thrust. On a short wing, the leading edge vortex is significant and spins in a counter-clockwise (positive) direction. When it reaches the trailing edge, it meets a vortex spinning clockwise (negative). The interference of the two vortices weakens the shed vortex, thereby slowing the wing. Lengthening the wing weakens the leading edge vortex, which reduces its interference at the trailing edge and makes the longer wings more efficient. (Video credit: T. Mitchel et al.; via @AlbanSauret)

Phytoplankton Bloom
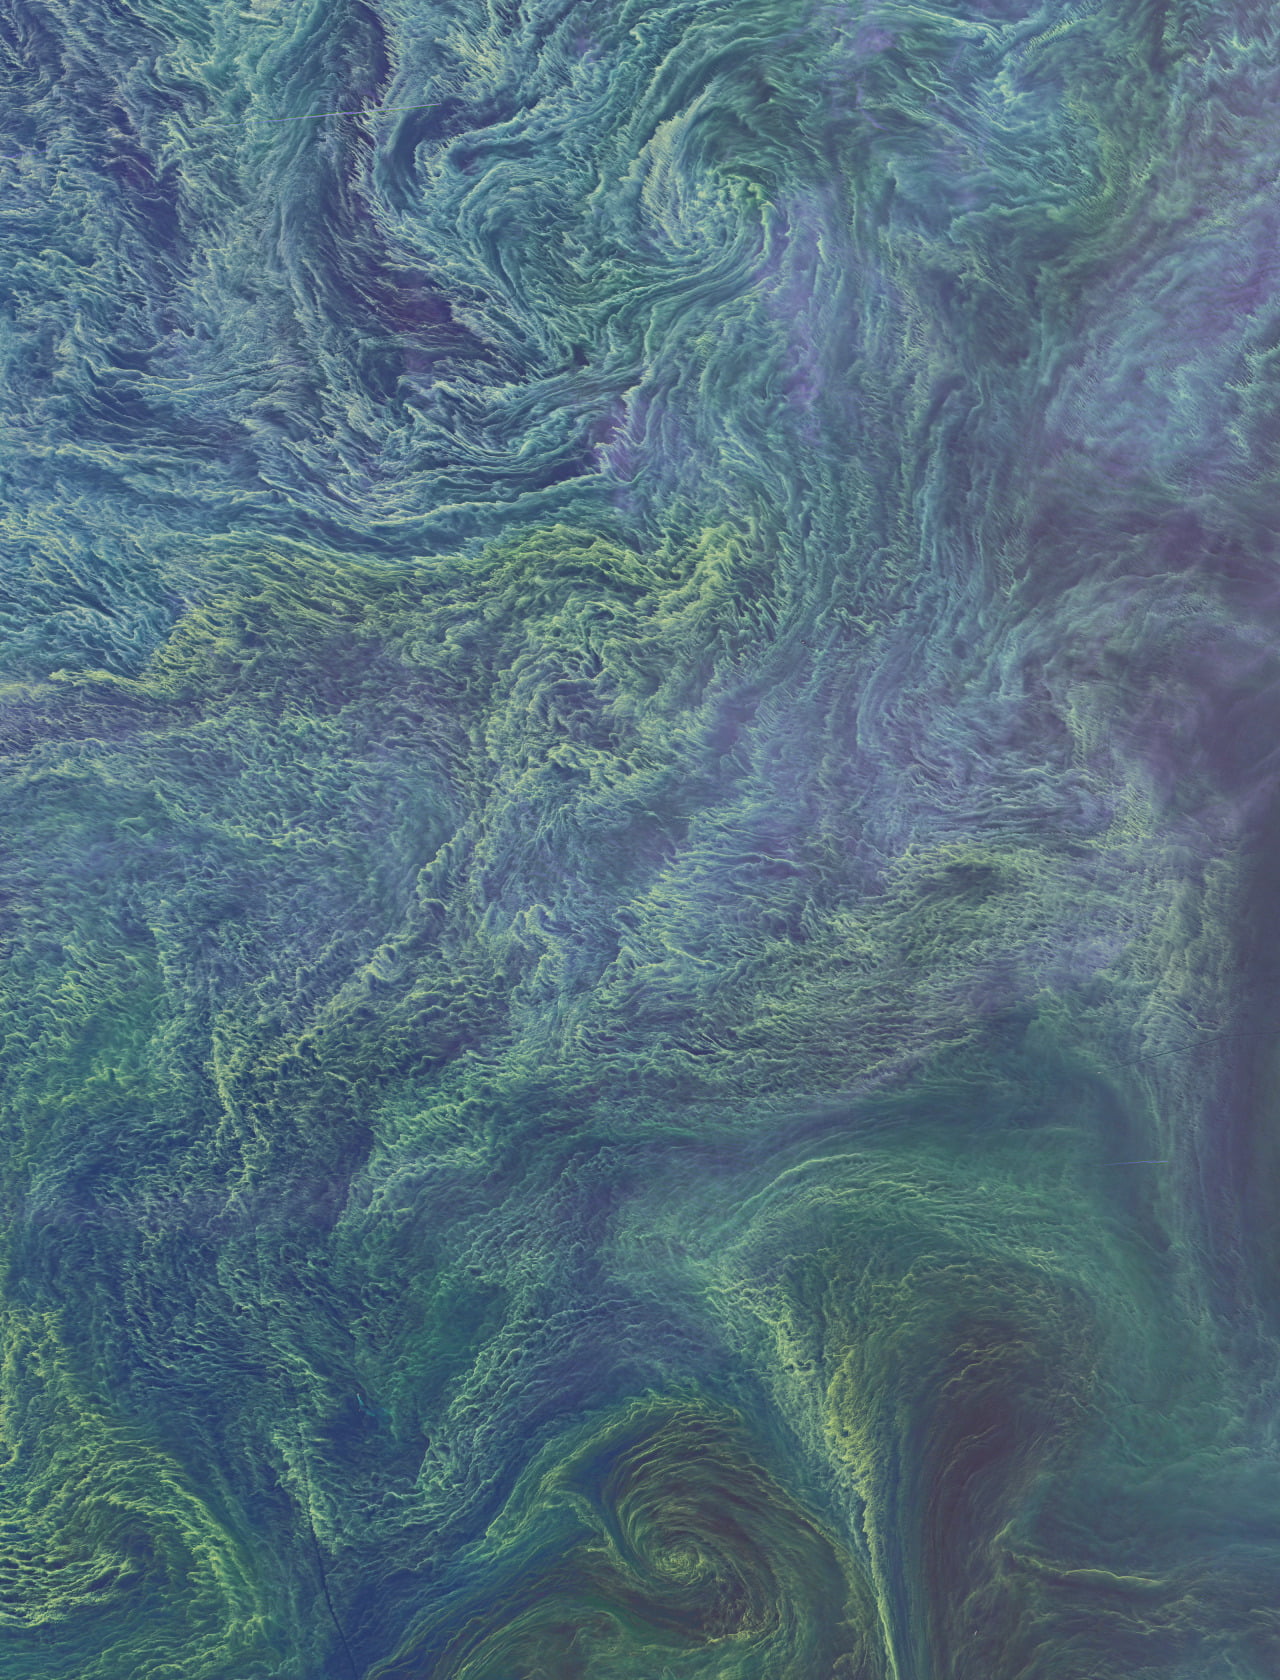
This incredible false-color satellite image shows a cyanobacteria phytoplankton bloom in the Baltic Sea. The image is roughly 900 km across and is beautifully detailed. Check out the full resolution version. The tiny phytoplankton act like tracer particles in the flow, sketching out the massive whorls as well as the tiny lacy wisps that make up the turbulent sea. Beautiful as they appear from orbit, such massive blooms can be dangerous to animal life, depriving large areas of the oxygen other animals need to survive. In recent years more and more large phytoplankton blooms are happening around the world as agricultural and industrial run-off supply waters with excess nitrogen and other nutrients favored by the phytoplankton. (Image credit: NASA Earth Observatory)


