The schlieren photographic technique is often used to visualize shock waves and other strong but invisible flows. But a sensitive set-up can show much weaker changes in density and pressure. Here, schlieren is used to show the standing sound wave used in ultrasonic levitation. By placing the glass plate at precisely the right distance relative to a speaker, you can reflect the sound wave back on itself in a standing wave, seen here as light and dark bands. The light bands mark the high-pressure nodes, where the pressure generated by the sound waves is large enough to counteract the force of gravity on small styrofoam balls. This allows them to levitate but only in the thin bands seen in the schlieren. Move the plate and the standing wave will be disrupted, causing the bands to fade out and the balls to fall. (Video and image credit: Harvard Natural Sciences Lecture Demonstrations)
Tag: flow visualization

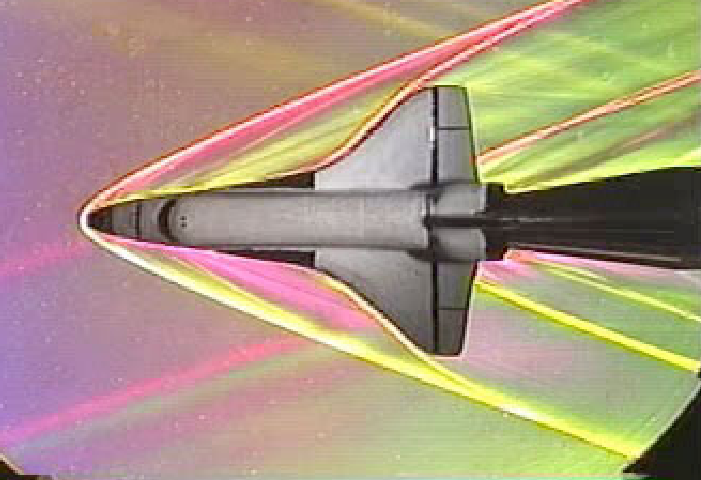
Space Shuttle Sonic Booms
The Space Shuttle had a famous double sonic boom when passing overhead during re-entry. This schlieren flow visualization of a model shuttle at Mach 3 reveals the source of the sound: the fore and aft shock waves on the vehicle. The nose of the shuttle generates the strongest shock wave since it is the first part of the vehicle the flow interacts with. This initial shock wave turns the flow outward and around the shuttle. The second boom comes from the back of the shuttle and serves to turn the flow back in to fill the wake behind the shuttle. (The actual shock wave would look a little different than this one because there’s no sting holding the shuttle like there is with the model.) The other major shock wave comes from the shuttle’s wings, but, at least for this Mach number, the wing shock wave merges with the bow shock, making the two indistinguishable. (Image credit: G. Settles, source)

Chemistry in Infrared


Many chemical reactions, and the flows that accompany them, are invisible to the human eye. But in infrared wavelengths those same events are vibrant and energetic. In this video from the Beauty of Science group, various chemical reactions are shown in visible and IR wavelengths, revealing very different perspectives on the same thing. Many of the reactions are exothermic, meaning that they produce heat as they occur. Because of this the thermal imaging shows where the most intense reaction is occurring at a given time. Other areas gradually darken as diffusion and flow move and dilute the heat energy released. (Video and image credit: Beauty of Science, source)
“Moving Creates Vortices and Vortices Create Movement”
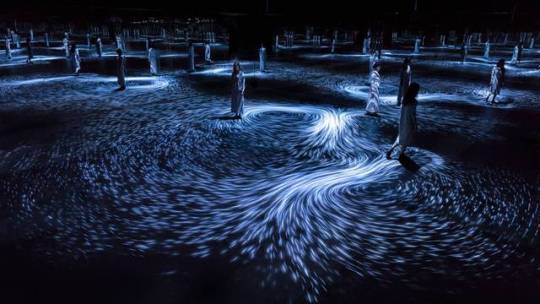

A new interactive installation by the Japanese art collective teamLab uses the movement of visitors to drive vortex motion. Entitled “Moving Creates Vortices and Vortices Create Movement,” the installation uses projectors in a mirror room to create the sensation of an infinite, indoor ocean that’s constantly churned by the paths visitors take. In the absence of motion, the room slowly fades to darkness. The installation is currently in the National Gallery of Victoria in Melbourne, Australia, and will be open until April 15th, 2018. (Image credit: teamLab; via Colossal; submitted by jshoer)
P.S. – Winter Olympic coverage will start on Monday, February 12th! – Nicole

Juno’s Citizen Science


The Juno mission’s JunoCam has been producing stunning photos each time the spacecraft swoops past Jupiter. The instrument has a planning team, but its primary use is for citizen scientists, who have been suggesting images to take each orbit and have been processing those images. Most of the photos we see are like the one on the left above – photos that have been heavily color-enhanced to highlight details. The image on the right shows what Jupiter would look like to the human eye. Look closely, and you’ll catch many of the same colors and shapes in both photos.
At a recent conference, a member of JunoCam’s team presented scientific results that have come from the instrument, including analysis of Jupiter’s polar storm systems (8 vortices for the north pole and 5 for the south), tantalizing hints at Jovian equivalents to earthly cloud types, and more. She also announced a new Analysis page where members of the public can both see the science in progress and participate first-hand! (Image credit: NASA / SwRI / MSSS / G. Eichstädt / S. Doran; NASA / JPL-Caltech / SwRI / MSSS / B. Jónsson; via E. Lakdawalla; submitted by jshoer)

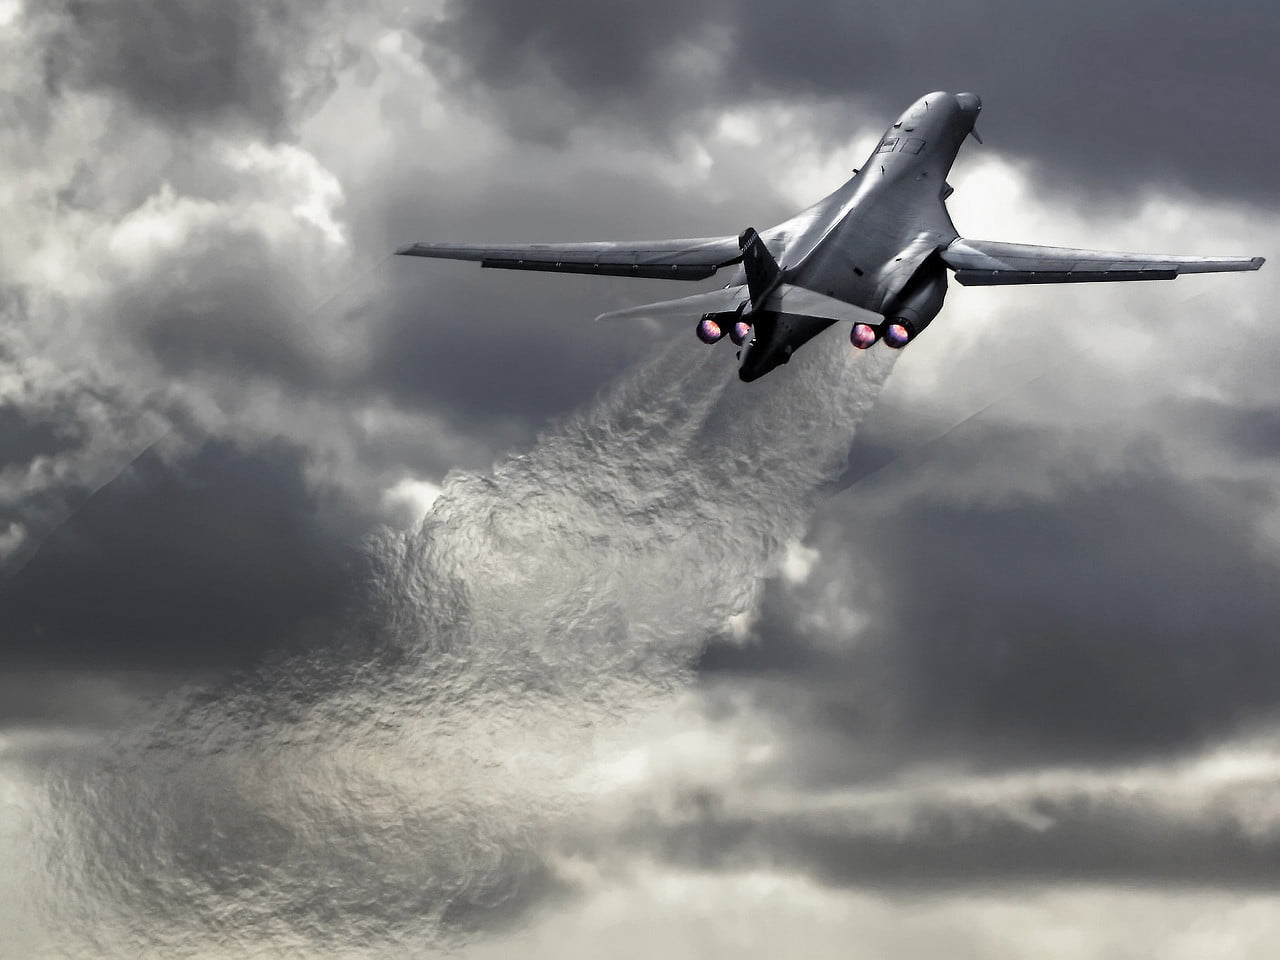
Seeing the Wake
Hot exhaust gases churn in the wake of this climbing B-1B Lancer. The high temperature of the exhaust changes the density and, thus, the refractive index of the gases relative to the atmosphere. Light traveling through the exhaust gets distorted, making the highly turbulent flow visible to the human eye. Note how the four individual engine exhaust plumes quickly combine into one indistinguishable wake. This is typical for turbulence; it’s hard to track where any given fluctuations originally came from. The airplane’s wingtip vortices are just visible as well, if you look closely. (Image credit: T. Rogoway; submitted by Mark S.)

Breaking Up Turbulence
Under most circumstances, we think about flows changing from ordered and laminar to random and turbulent. But it’s actually possible for disordered flows to become laminar again. This is what we see happening in the clip above. Upstream, the flow in this pipe is turbulent (left). Then four rotors are used to perturb the flow (center). This disrupts the turbulence and causes the flow to become laminar again downstream (right). To understand how this works, we have to talk about one of the fundamental concepts in turbulence: the energy cascade.
Turbulent flows are known for their large range of length scales. Think about a volcanic plume, for example. Some of the turbulent motions in the plume may be a hundred meters across, but there are a continuous range of smaller scales as well, all the way down to a centimeter or less in size. In a turbulent flow, energy starts at the largest scales and flows further and further down until it reaches scales small enough that viscosity can extinguish them.
That should offer a hint as to what’s happening here. The rotors are perturbing the flow, yes, but they’re also breaking the larger turbulent scales down into smaller ones. The smaller the largest lengthscales of the flow are, the more quickly their energy will decay to the smallest lengthscales where viscosity can damp them out. This is what we see here. Once the turbulent energy is concentrated at the smallest scales, viscosity damps them out and the flow returns to laminar. Check out the full video below for a cool sequence where the camera moves alongside the pipe so you can watch the turbulence fading as it moves downstream. (Image and video credit: J. Kühnen et al.)
ETA: As it turns out, there’s more going on here than I’d originally thought. Simulations show that breaking up length scales is not the primary cause of relaminarization in this case. Instead, the rotors are modifying the velocity profile across the pipe in such a way that it tends to cause the turbulence to die out. The full paper is now out in Nature Physics and on arXiv.

The Fishbone
The simple collision of two liquid jets can form striking and beautiful patterns. Here the two jets strike one another diagonally near the top of the animation. One is slanted into the screen; the other slants outward. At their point of contact, the liquid spreads into a sheet and forms what’s known as a fishbone pattern. The water forms a thicker rim at the edge of the sheet, and this rim destabilizes when surface tension can no longer balance the momentum of the fluid. Fingers of liquid form along the edge, stretching outward until they break apart into droplets. Ultimately, this instability tears the liquid sheet apart. Under the right conditions, all kinds of beautiful shapes form in a system like this. (Image credit: V. Sanjay et al., source)

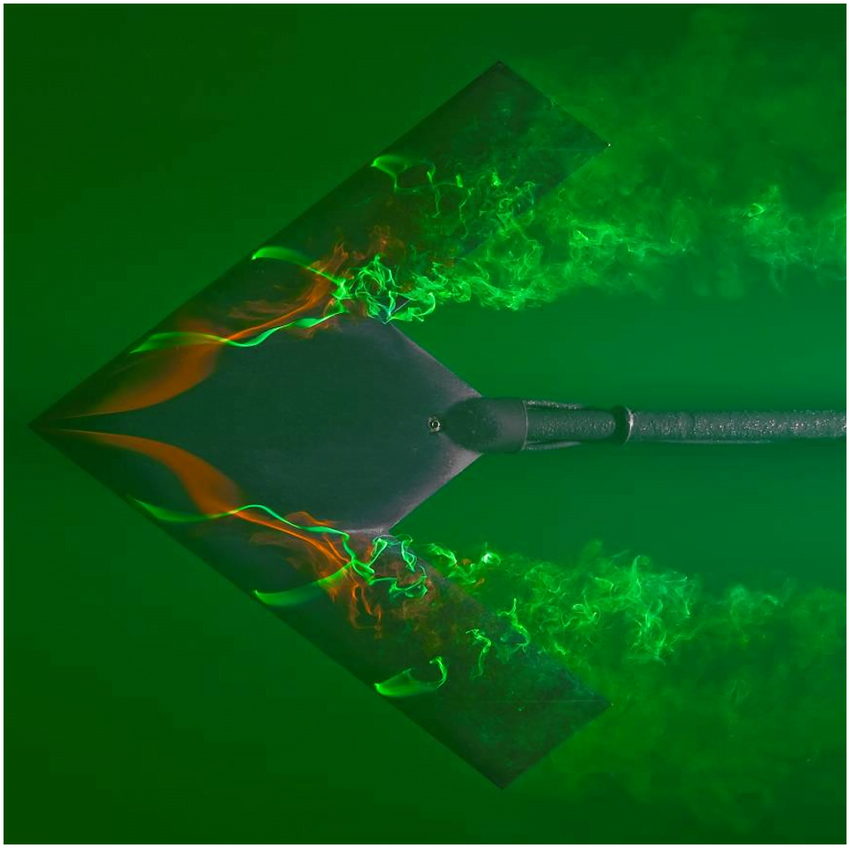
Delta Wing Flow Viz
Designing new aerodynamic vehicles typically requires a combination of multiple experimental and numerical techniques. The photo above shows a model for an unmanned flying wing-type vehicle. Here it’s tested in a water tunnel with dye introduced to the flow to highlight different areas. The model is at a high angle of attack (18 degrees) relative to the oncoming flow. This puts it in danger of flow separation and stall, the point where a wing experiences a drastic loss in lift. The smooth flow over the front of the model indicates it hasn’t reached this point yet, but notice how both the green and red dyes are separating from the model and becoming very turbulent over the back of the wing. If the model were pushed to an even higher angle of attack, that separation point would move further forward, bringing stall that much closer. (Image credit: L. Erm and J. Drobik; research credit: R. Cummings and A. Schütte)
Rolling Along
Leidenfrost drops – droplets deposited onto a surface much hotter than their boiling point – are known for their mobility. With the right surface, they can be propelled, trapped, and even guided through a maze, typically by directing the vapor layer that cushions them. But new work shows that these drops have internal dynamics that also contribute to their propulsion.
By adding tracer particles to each droplet, researchers can visualize flows inside the droplet. Large drops tend to have a flatter shape and contain two or more rotating vortices. Such drops won’t propel themselves without another force in play. But smaller droplets are more spherical and contain only a single rotating flow. Once these drops detach, they roll away! Despite the similarity to wheels, these liquid drops aren’t moving the same way. Remember that the drop is not actually in contact with the surface. To see what sets the drop’s direction, researchers examined the shape of the bottom of the drop. They found that it sits at a slant on its vapor cushion. That pushes evaporating gases out one side, propelling the drop the other way. (Image and video credit: A. Bouillant et al., source)