


The wingtip vortices of aircraft provide a veritable cornucopia of gorgeous imagery. There’s something inherently fascinating about these vortices that stretch behind moving aircraft. But four-engine aircraft add an extra twist to the imagery, as seen here.
With four engines, these aircraft produce four separate contrails, each of which acts like a streakline for the flow behind the wing. So what we see in these images is not the wingtip vortices themselves, but what their effect is on flow moving across different parts of the wing.
Nearby vortices influence one another, and one of the earliest models of aircraft physics takes advantage of this by modeling the wing itself as a series of vortices. Odd as it sounds, such models are quite good for capturing the basic flow physics behind a finite wing.
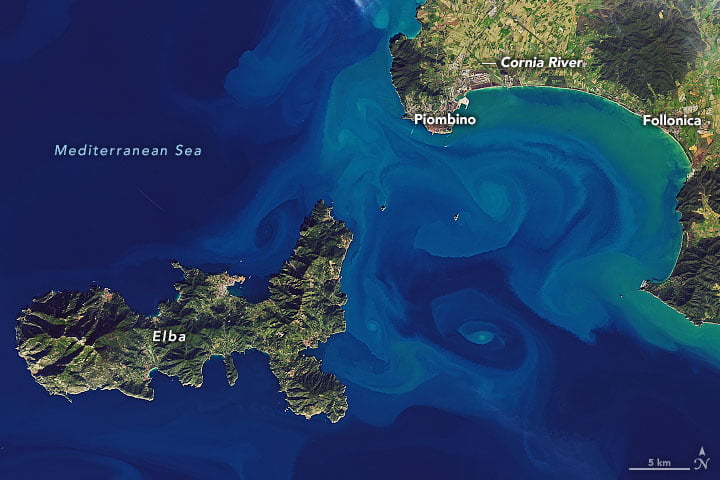
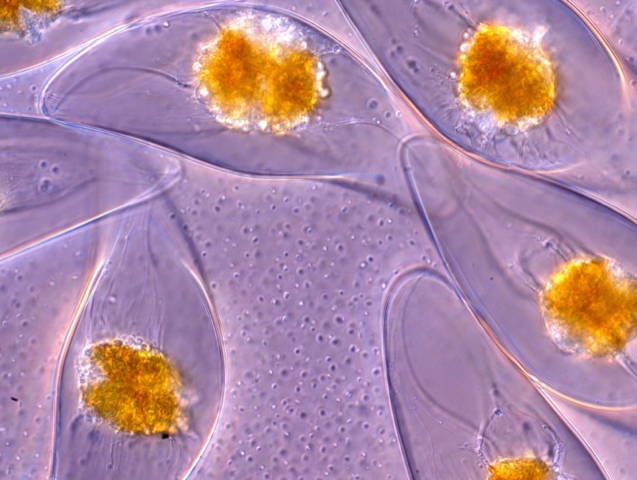
Using one of these models, Joseph Straccia explored the physics of a 4-engine aircraft’s wake (Image 4), predicting that the outboard engine contrails should initially move outward before getting rolled up and inward by the wingtip vortices. That’s exactly what we see in these images, particularly Image 1. The inboard contrails undergo less deflection, as expected since they are further from the wingtips. (Image credits: aircraft and contrails – JPC Van Heijst, J. Willems, and E. Karakas; modeling and submission – J. Straccia)


